In this unit students read, write and solve multistep equations that include variables that stand for fixed values. Importantly, students also come to see that a variable can be interpreted in other ways, including representing a quantity that varies in relation to another quantity.
- Recognise that to find the value of the variable, you have to ‘undo’ what has been done to it.
- Review and solve single step whole number equations that include a variable.
- Solve two-step equations and represent the solution using materials.
- Represent number relationships using words, a table and a graph, and recognise the importance of these representations.
- Write equations, using variables and brackets, to express problem situations.
- Solve equations that have unknown amounts on both sides.
Algebraic symbols are tools that we use to represent complex ideas in a concise way. This is the final unit in a series that develops understanding of the set of basic symbols, including variables, which we use to communicate and to think. It further develops understanding of the relationships that exist between numbers and number operations. Fundamental to a student’s ability to solve equations involving variables, is their recognition of the relationship of equivalence in an equation, seeing it conceptually as ‘an object that balances.’
Students have been formally introduced to a letter symbol as an unknown that represents a fixed amount. The unknown has been ‘found’ by performing just one number operation that isolates the variable and reveals its value. For example, 3n = 24, so 3n (÷ 3) = 24 ÷ 3 = 8. Students need to have opportunities to solve problems in which more than one step must be followed to find the value of the unknown, including when unknowns are found on both sides of an equation. It is important to scaffold these steps, making obvious the number properties that are at work. Students need opportunities to question and explain what is happening, if they are to operate with understanding on problems, rather than simply following a learned procedure.
A student’s understanding of a variable needs to go beyond simply recognising that letters stand for unknown numbers in equations, in other words fulfilling ‘place holder’ role. Students also must come to recognise that a variable can be interpreted in other ways, including representing a quantity that varies in relation to another quantity, for example y = 3x.
Students must become comfortable in giving verbal explanations for symbolic expressions and in representing these quantitative relationships in a table or a graph. This scaffolds the student’s ability to recognise and discuss both linear and non-linear relationships and their representations.
Having a sound understanding of the symbols and expressions that we use to think mathematically means that students can generalise, test conjectures, express and interpret the patterns and relationships that they see, and operate within a range of mathematical contexts, expressing their mathematical ideas with confidence and understanding.
The learning opportunities in this unit can be differentiated by providing or removing support to students and by varying the task requirements. Ways to differentiate include:
- Begin with situations in which the multiplier (coefficient) of n is a simple factor, like two, five or ten.
- Develop the use of tables and graphs to organise data from a situation and look for patterns.
- Physically or diagrammatically model the patterns so students can ‘see’ how the pattern develops and test conjectures about rules that might work.
- Work with digital tools, including spreadsheets and graphing application, to develop rule seeking and equation forming.
- Explicitly teach the conventions of the same operation applied to both sides of an equation. Discuss the concept of equality as ‘transitive balance’ and ask students to record steps systematically.
- Use the four progressive versions of the Visual Linear Algebra learning object to differentiate the challenge for students.
The context for this unit is town planning and includes creating cube models in 3 dimensions and calculating surface areas and perimeters. Those contexts will appeal to most students. You might use other contexts relevant to your students, in which there is a constant difference between consecutive terms (linear relationships). For example, buildings might be different from towers, gardens can become tapa cloth or a mosaic, and perimeters could be boundary fences around a marae or village hall.
The context for this unit of work is small-town planning. Alternatively, these teaching sessions can be creatively integrated into a current art or construction project within a classroom.
This unit complements tasks that involve patterning investigations. There are five sessions in this unit but that the number can be increased, as appropriate, to ensure the concepts are fully understood.
Session 1
SLOs:
- Recognise that to find the value of the variable, you have to ‘undo’ what has been done to it.
- Review and solve single step whole number equations that include a variable.
- Write expressions using variables.
Activty 1
- Introduce the context by asking students, ‘Who is responsible for planning a town?’ List ideas on the class chart, including the students’ ideas about the scope of the town planner’s work.
Explain that the lessons will be exploring some simple building and planning tasks. - Make a large number of cubes, pencils, isometric and plain paper, and a small piece of card available to the students. Explain that they will use the cubes to ‘make’ buildings for a town.
Have each student choose and write down a number from 5 to 9. Have them take several handfuls of cubes each, sufficient to make at least five ‘buildings’ of their own, each of which is made with the chosen number of cubes. - Pose this task, setting an appropriate time limit.
- Make, and draw on isometric paper, as many buildings as you can with the cubes you have taken. (Have students write their names on the back of the isometric paper.)
- Each building must use exactly the number of cubes as the number you have chosen and written.
- Each building must be different, but one should be a tower.
- Set aside any left over cubes.
- Stop the students after the set time. Choose a student and ask them to hide their favourite building from view.
I will ask for a clue. If I make six of your buildings, how many cubes in total do I need?
The students should reply with a product that you can work with, say 30 cubes in total. You might record:
6n = 30
What does this equation mean? What does n refer to?
Students should tell you that n is the unknown number needed for each building.
What is n? How do you know?
Students should tell you that n equals five, possibly by dividing 30 by six.
Record:
6n = 30
n = 5
What happened in the step between these two equations? (Both sides were divided by six)
Check the student’s building to see that the value for n is correct. - Ask other students to hide their buildings. Other clues could be asked like:
If I added ten cubes to your building how many would there be in total? (n + 10 = )
If I divided your building in half, how many cubes would be in each half? (n/2 = )
Students might work in pairs to pose clues in similar ways. - Ask students to choose a building that has a different number of cubes. Tell them to record an equation for a classmate solve to find the number of cubes in their building. Give some examples, like n/3 = 3 or 7n = 21. Record the equations on the small cards.
- Have students display their isometric drawings and cube buildings (on their desks or work areas). Shuffle the cards. Distribute the equation cards randomly, one per student. Ask students to move around the displays, seeking the drawing that matches the equations on the card they have been given. Note that there will be several matching buildings. When the students have made a match, have them form pairs with the matching drawing and card, and take turns to interpret each equation and explain it in words with reference to the drawings.
For example:
6n = 30 “Six buildings each made with five cubes use thirty cubes altogether.”
Or giving a longer explanation such as:
30/n = 6
“Thirty cubes, divided by the number of cubes in each building, makes six buildings. Each building, n, must have five cubes because six times five is thirty so thirty divided by five equals six.” - Gather as a class. Share the strategies students used to solve the equations. Focus strongly on undoing operations. Addition is undone by subtraction and multiplication is undone by division. Operations that undone one another are called inverse operations. For example:
24/n = 3
24 = 3n (undoing dividing by n through multiplying both sides by n)
8 = n (undoing multiplying by three through dividing both sides by three)
Activity 2
- Have students claim their equation cards and return to their own models. Ask the students to take the spare cubes that they had set aside, or to now take up to 4 extra cubes if they have no spare cubes left over from their buildings.
Pose the problem:
Can you rewrite at least two of your equations expressing the total number of cubes you have now? Continue to use n to represent the number of cubes in each building.
Give students time to consider this themselves, then have them discuss this with a partner and compare what they have written. - Gather as a class. Have some students share their equations and explain their thinking. As they do so, highlight the fact that they had to add the extra number of spare cubes to both sides of the equation, to ‘keep the balance’.
For example: 6n = 30 with 3 spare becomes 6n + 3 = 33
Share a number of examples, discussing the equations with reference to the cube models the students have created. - Write on the class chart several of the operation examples such as:
6n + 3 = 33
5n + 2 = 37
8n + 4 = 68
Have students work in pairs to discuss how they might approach these problems to find the value of n, in other words how many cubes are in one building. - Together share and discuss solutions, highlighting the need to remove the ‘spare cubes’ from both sides of the equation.
Have students return their cubes, but retain their isometric drawings and equation cards and recordings for Session 2.
Activity 3
Conclude the session by discussing learning, including the fact that they have written equations to represent or express actions they have taken with practical materials.
Session 2
SLOs:
- Recognise equations that cannot be solved in one step.
- Identify the logical order for solving two-step equations.
- Write equations to express physical representations (of problems).
Activity 1
- Review conclusions from Session 1, Activity 4.
Explain that today we will be thinking about and making buildings of different heights.
Write on the class chart four previously unseen equations such as:
5n + 1 = 46
7n + 4 = 32
8n + 3 = 27
6n + 2 = 38
Make available isometric paper and pencils. Have students work in pairs to:- Take turns to explain what each of the four equations would look like if modelled as buildings, using cubes.
- Each select one different equation of the four and represent it on isometric paper. Explain that, for simplicity, the buildings should all be represented simply as towers. (Model and make cubes available as necessary.)

- Have students pair-share their work, briefly explaining their representation including the spare cubes.
- As a class, refer to one of the equations on the chart and model how to formally record a solution. For example:
5n + 1 = 46
5n + 1 – 1 = 46 – 1
5n = 45
5n/5 = 45/5
n = 9
Have students explain the steps in words.
Notice and have the students explain that +1 – 1 = 0 (the additive inverse).
Have students talk through in pairs the steps they would take in working out and recording their solutions for the other three equations.
Activity 2
- Write these problems on the class chart:
“ I have 78 cubes. These are 3 cubes fewer than the number I need to make nine towers.”
“I’ve nearly made 12 towers from my 69 cubes, but I’m 3 cubes short.”
Pose the problem for students to work on individually:
Write an equation to express each of my cubes problems.
Show how you would work out how many cubes are in each tower in the two different problems. - Have students share their thinking and recording in pairs.
- As a class agree on the equations and steps taken to solve each problem.
78 = 9n – 3
78 + 3 = 9n – 3 + 3
81 = 9n
81/9 = 9n/9
9 = n - Distribute Attachment 1 (Town towers) to each student. Make calculators available. Discuss as required.
Have students keep Attachment 1 for Session 3.
Session 3
SLOs:
- Solve two-step equations and represent the solution using materials.
- Represent number relationships using words, a table and a graph, and recognise the importance of these representations.
Activity 1
- Begin this session with student pairs comparing and discussing their responses to Town Towers (Attachment 1) problems from Session 2, Activity 2, Step 4.
- As a class, discuss any questions or issues that arise.
Activity 2
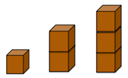
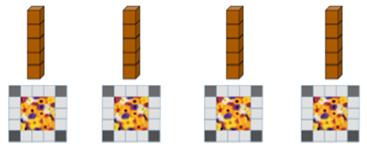
- Have a student draw on the class chart Tower A, the first of the four town towers from the first section of Attachment 1.

Explain that the Mobile Maintenance Company has to paint and keep clean the outside faces of each storey of the building, as well as the flat roof.
Have students discuss how many faces that is altogether for this building with two storeys.
Model and check with cubes. Agree it is 9 faces, including the roof.
Brainstorm together on the class chart how this could be represented in an equation. Accept all suggestions till it is agreed that the situation is best expressed as: 4n + 1 = 9
Have a student explain that there are four faces on each storey (n) plus the roof face: Four faces on each of two storeys, plus the roof, is nine faces. - Distribute Attachment 2 (Mobile Maintenance) to each student. Make the connections to Attachment 1. Have students record equations below each of the other three towers (B, C, D), to show the number of faces needing maintenance on each of the buildings.
(4n + 1 = 29, 4n + 1 = 17, 4n + 1 = 13) - Have the students draw four different tower buildings, write the equation to express the number of faces.
Activity 3
- Place these 3 towers in front of the students:
Draw an empty table on the class chart.Number of faces Number of storeys - Have students discuss together how this might be completed, only writing in the first three paired numbers, representing the three towers.
Have them recognise that 4n + 1 describes the relationship between each of the paired numbers in the three columns. - Have them work in pairs, with each student completing their own copy of Attachment 2.
- When their graph is complete, have students:
1. Circle three points on their graph and describe the relationship at that point, with an equation and with words.
2. Explain how many faces would be on a 20 storey, 100 storey building and how they know.
Activity 4
Reflect on the learning in this session noting, in particular:
- Relationships can be expressed in words, with an equation, on a table and on a graph
- The relationship 4n + 1 forms a straight line on the graph
- That a relationship expression that includes a variable, can help us to solve problems for any number (in a given context).
Session 4
SLO:
- Write equations, using variables and brackets, to express problem situations.
Activity 1
- Draw the diagram below and share this this scenario.
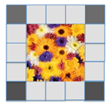
The town planner has designed small square gardens to be located in front of each of the town towers. Each garden has a grey tiled border, with a darker tile in each corner.
Make graph and plain paper, and pencils available.
Pose this problem:
Show with a diagram, equation and table how the planner can work out how many square tiles he needs of each colour for one square garden border, for four garden borders or for any number of gardens which have three pale grey tiles on each side.
Give student pairs time to discuss this. Scaffold the use of brackets in the equation as required to reach a solution:
Where the number of pale grey tiles, n = 3.1 garden: 4n + 4 = 12 (pale grey tiles) + 4 (dark grey tiles) 4 gardens: 4(4n + 4) = 16n + 16 = 48 + 16 20 gardens: 20(4n + 4) = 80n + 80 = 240 + 80 - Have students pair share their results and how they used symbols to represent the situation.
- Pose the problem:
What if n = 5? (there were 5 pale grey tiles on each side of the square).
Have students show the relationship with a diagram, equation and table.
Activity 2
- Pose the problem:
The town planner decides to make rectangular gardens in which there are two longer sides and two shorter sides. Suggest and show how we could work out the number of tiles needed. - Have students in pairs discuss and explain their equations.
Activity 3
Conclude this session by reviewing learning. Highlight that the focus has been on writing equations using a variable and brackets, to express problem situations.
Session 5
SLOs:
- Solve equations that have unknown amounts on both sides.
- Understand that a variable can be used to represent a quantity that varies in relation to another quantity.
- Understand and explain a simple example of covariation in which variables can have different values.
Activity 1
- Begin by reviewing the way in which we use symbols and expressions to think mathematically about problem situations. Take time to review the small town scenarios that have been explored so far: building maintenance and garden planning.
Highlight the importance of understanding the problem situation and being able to express it, using an equation and also to be able to solve equations, maintaining the balance by ‘treating’ both sides of the equation in the same way. - Make toothpicks, pencils and paper available.
Explain and show with a simple diagram, this scenario.
In the town there are some small parks and open spaces of similar size.
Two of these require perimeter fencing to contain access to nearby stream.
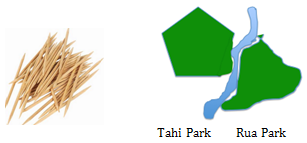
Each of the two parks uses the same total number of fence posts, since the perimeters are the same.
Because the parks are different shapes, the posts are organised in different ways. Where parts of the perimeter fence have the same length and have the same number of posts, n is used.
Tahi Park uses 4n + 14 and Rua Park uses n + 62.
We know that 4n + 14 = n + 62
How many posts are used for each perimeter fence?
Give student pairs time to consider the problem and reach solutions. - Record on the class chart, student approaches to the problem.
Agree that to solve the equation we need to ‘isolate’ n and do the same to both sides. (Have a student) Model the solution formally, step by step.
4n + 14 = n + 62
4n + 14 – 14 = n + 62 – 14 (discuss the additive inverse + 14 – 14 = 0)
4n = n + 48
4n – n = n – n + 48 (discuss the additive inverse + n – n = 0)
3n = 48
n = 16 - Have students write the equation, substituting 16 for n to check their solution.
If necessary, they can check with the toothpick fence posts.
Refer to the “rough map” suggesting how the fence posts might be configured.
(Tahi Park 16 on each of four straight sides + 14 near the stream; Rua Park :16 along one straight side border near the stream and 62 fitting around the large uneven outer perimeter.)
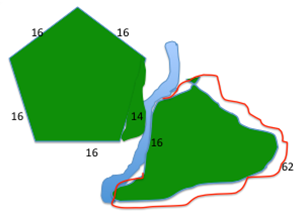
Conclude that 78 fence posts are used to fence each of the spaces. - Pose this problem:
What if these equations represent two parks in which the same number of fence posts is used around the perimeter of each park?
3n + 5 = 2n + 20 - 5n – 4 = 4n + 6
6n – 2 = 4n + 22
Work in pairs but make your own recording to:- Find the value of n in each equation
- Check by substituting the value for n and calculating.
- Identify the number of posts used for each pair of park spaces.
- Roughly draw each park space showing how the posts are used.
- Have students each draw and write at least one park scenario of their own, then give their equation to their partner to solve and to draw.
- As a class, discuss what they have learned as they have been solving these equations with unknown amounts on each side.
Highlight the importance of the relationship of equivalence in an equation.
Activity 2
- Make pencils, paper and calculators available.
Pose the final town scenario:
In the centre of the town is a small lake, Lake x. On the outskirts of the town is a larger lake, Lake y exactly three times the size (capacity) of the smaller lake. They are part of the town water supply.
Ask: Is it possible to calculate the volume of water in both lakes as it changes with more or less rain, if the volume of only one lake is known?
Write this table on the class chart.
Have the students copy and complete the table, and write an equation to explain the relationship between the lakes.Lake x Lake y 162,000m3 48,000m3 42,500m3 178,000m3 - Agree and record on the class chart that the relationship is: y = 3x
- Have student pairs think of and create their own small town scenario in which a variable is used to represent a quantity that varies in relation to another amount.
Make graph paper available.
Challenge students to create a graph that demonstrates the relationship in the scenario that they have created.
Share these ideas as a class, highlighting the value of the use of variables in this way to express relationships of covariation between amounts.
Activity 3
Conclude this series of lessons by reviewing class chart recording and reflecting on the way in which we use symbols and expressions to think mathematically about problem situations.
Dear parents and whānau,
In maths this week, our focus has been on finding the value of unknown amounts by solving equations. Here is a problem that your child has explored in class.
Try to solve the problem first, and then discuss your solution with your child, allowing them to ‘help’ you.
A small-town planner has designed small square gardens to be located along the town’s main street. Each garden has a grey tiled border, with a darker tile in each corner.

Show how the planner can work out how many square tiles he needs of each colour for one square garden border, for four garden borders and for any number of gardens with this many tiles.
Enjoy your discussions in which your child is the ‘expert’ and you are the learner.