This unit provides a way of looking at multivariate data (i.e. data that includes many variable, such as gender, age, height, eye colour, bedtime, etc.) that comes from a group of individuals. Data cards hold several pieces of information about individuals, and by sorting and organising a set of data cards, things can be found out about the group. This unit uses secondary data (data collected by others) as well as primary data (data collected by the class).
- Recognise what the variables are in a secondary data set.
- Sort the given data into categories.
- Answer investigative questions by sorting, organising and arranging data.
- Make sensible statements about the data with supporting evidence.
The key idea of statistical investigations at level 3 is telling the class story with supporting evidence. Students are building on the ideas from level two and their understanding of different aspects of the PPDAC (Problem, Plan, Data, Analysis, Conclusion) cycle – see Planning a statistical investigation – level 3 for a full description of all the phases of the PPDAC cycle. Key transitions at this level include posing summary investigative questions and collecting and displaying multivariate and simple time series data.
Summary or time series investigative questions will be posed and explored. Summary investigative questions need to be about the group of interest and have an aggregate focus, meaning the questions can be used to, find out about the whole group. For example, What position in the family are the students in our class? What are the reaction times of students in our class?
Data displays build on the frequency plots from level two and can be formalised into dot plots and bar graphs. Students should have opportunities to work with multivariate data sets, data cards are a good way to do this. Data cards allow students to flexibly sort their data and to correct errors or make adjustments quickly.
Students will be making summary statements, for example, the most common reaction score for our class is 13 cm, five people have a reaction score of 12 cm (read the data), or most students (16 students out of the 27 in our class) have a reaction score between 13 and 14 cm (read between the data). Teachers should be encouraging students to read beyond the data by asking questions such as: “If a new student joined our class, what reaction score do you think they would have?”
The learning opportunities in this unit can be differentiated by providing or removing support to students and by varying the task requirements. Ways to support students include:
- setting up the plan for data collection for students to follow
- altering the type of data collected; categorical data can be easier to manage than numerical data
- altering the type of analysis – and the support given to do the analysis
- providing prompts, and examples if necessary, for writing descriptive statements.
The context for this unit can be adapted to suit the interests and experiences of your students. Preparing data cards with other information on them (sourced from Census At School New Zealand) that will be of interest to your students is one way to do this. Students will be interested in questions they can ask their classmates that are of significance to them, such as “How fluent are you at speaking te reo?”, “What is your marae, maunga, iwi, etc.?”, “Should fireworks only be seen in public displays?”, or “Does your whānau grow their own vegetables at home?” Māori can also be used alongside English on the data cards to develop students’ use of te reo Māori. Consider how you can use the data discussed, and found, throughout these lessons to inform learning in other curriculum areas (e.g. persuasive writing).
Te reo Māori vocabulary terms such as tirohanga tauanga (statistical survey), kāri raraunga (data card), taurangi (variable) and kohikohi raraunga (data collection) could be introduced in this unit and used throughout other mathematical learning.
- Scissors
- Paper and pencils
- Data Set One Master
- Data Set Two Master
- Data Set Three Master
- Blank Data cards
Session One
Part One – Introducing Data Set One
- Organise the students into pairs, hand out a set of data cards to each pair, Data Set One Master, and get them to cut out all the data cards. Students should collect the cards together and select one of the data cards each to have a look at. Consider how you can encourage tuakana-teina by pairing more students who are more confident in maths, with students who might benefit from additional support.
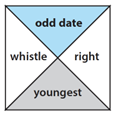
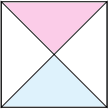
- Tell the students that this is a data card. A data card is a piece of paper containing information or data about a person. The data for these data cards has been collected by asking four survey questions. What do you think the survey questions were? Seek ideas from the class. They may just give you the variable description which is fine, such as "that is whether they are the oldest or youngest in their family".
- Confirm that the information on these data cards comes from the following four survey questions:
- Do more students have odd or even birthdates? Gives the top variable in the data card
- Can you whistle? Gives the left variable in the data card
- Are you the oldest, youngest or a middle child in your family? (Only children are classified as oldest) gives the bottom variable in the data card
- Which hand do you write with to produce your neatest work? Gives the right variable in the data card.
- Get the students to put the data set to one side, we will come back and use it again soon.
Part Two – Making Class Data Cards
- Show the data card below.
- Ask the class to tell you something about this student.
- Does anyone in the class fit this data card?
- Do you know someone that fits this data card that is not in this class?
- How many people could this data card be correct for?
- Discuss the importance of knowing exactly what each piece of data is about, i.e. the importance of specific survey questions. Discuss how some students could answer the same survey question differently, e.g. "Are you right handed or left handed?" could give two different answers for the person who throws a ball with one hand and writes with the other. Survey questions need to be specific, with no ambiguous answers. Hence the survey question about handedness specifically asked about which hand your write with to produce your neatest work and not just "Are you left-handed or right-handed?"
- Ask: What would a data card about you look like for these same four survey questions?
- Hand out a blank data card for each student to fill out. Once completed collect all data cards.
- After this session the teacher needs to photocopy all the data cards onto a piece of paper, one set for each pair of students in the class. Photocopying onto coloured paper is suggested to make it easy to recognise the class’s data set. This data set will be used during the next session.
Part Three – Working with data set one
- Ask the students to get the set of data cards they cut out. Have the students sort and organise the data cards to find out things about this group of students.
- Encourage the students to look for multi-dimensional interesting things. This means looking for interesting things within different categories rather than simply counting the number in categories. For example, rather than seeing if there are more odd birthdates than even birthdates or more whistlers than non-whistlers, look to see if more odd birthdates than even birthdates are left handed or if there is a link between place in family and the ability to whistle.
- Arranging the data cards like below, is one way to help see different patterns in the data.
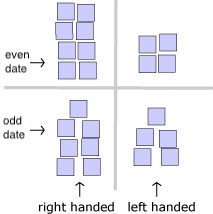
- Move around getting the students to explain and show what they have found out. Encourage students to add detail to their observations. This could include thinking proportionally. For example, rather than "One more even date is right handed than odd date", "A larger fraction of even date are right handed, 8 out of 12 even date in comparison to 7 out of 12 odd date are right handed." More able students are to be encouraged to think proportionally when the number in comparing groups is not the same, e.g. 8 out of 20 is a smaller proportion than 7 out of 9.
- The following questions could be asked to encourage thinking:
- Are there more whistling right-handers or whistling left-handers?
- Is there anything interesting when comparing place in the family and whistling?
- All the odd dates in this group who are the youngest can whistle, does this mean every odd date who is the youngest in their family can whistle?
- On a large piece of paper write up what the students discover or get each pair of students to write down what they found out about this group. Keep this information, as it can be used in the next session to compare with the class data set.
Session Two
During this session, students will be sorting and arranging data cards about themselves, i.e., the students’ own data cards.
- Before the class data set is handed out, remind the students about what they found out from Data Set One in Session One and how they organised the data cards to see discover patterns and differences.
- Briefly discuss what they expect to find out about their class:
- What do you expect to find out about the class?
- Will the things we found out about the unknown group from Data Set One, be different or similar to our class?
- Hand out a set of class data cards to each pair of students. The pairs cut out the data cards, then sort and arrange them, and look for patterns of interest. Move around getting students to explain and show what they have found out. Ask them to leave their final sort intact.
- Conclude the session by asking the whole class to wander around the final sorts of each group. Encourage ako by asking the displaying pair to explain the patterns and differences they found. Compare the findings to the statements the students made at the beginning of the session and share other things of interest.
Session Three
- Hand out a set of data cards, Data Set Two, to each pair of students. The pairs are to cut out the data cards for use in class. Ask the students to select one or two of the data cards they have just cut up. Tell them it is information from students in a class like ours, then ask them the following questions:
- What do you think the letter and numbers mean?
- Why are letters and numbers used instead of words?
- What specific survey questions could give the answers: O, 6, 10 or 13? Seek ideas from the class.
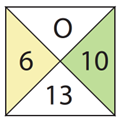
- Explain that the four survey questions for these data cards are:
- Is your birthday an odd or even number? – O (top)
- What year level are you at school? – 6 (left)
- How many years old are you? – 10 (right)
- What is your reaction score for catching a ruler, in centimatres? – 13 (bottom)
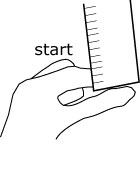
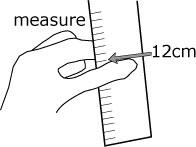
- The reaction score is the average length a ruler falls, before being caught, when it is dropped four times. To work out the reaction score, one student holds a ruler vertically above the test student’s first finger and thumb; the bottom of the ruler is in line with the top of the thumb. The ruler is released and the test student closes their finger and thumb as quickly as they can to catch the ruler. The number of centimetres the ruler falls through the finger and thumb is the score. This is repeated four times, with the scores averaged to give the reaction score. For example, if the ruler fell 12cm the first time, 15cm the second time, 11cm the third time and 14cm the fourth time, the average is 12 + 15 + 11 + 14 = 52, 52 ÷ 4 = 13, therefore, the reaction score is 13.
Ask students to anticipate what the data may show. Examples might be:- Older students will have better reaction scores than younger students
- Class level will always be five years less than age
- There should be the same number of odd and even birthdates
- Get the students to sort and arrange the data cards to look for patterns and differences of interest. Move around getting each pair of students to explain and show what they have found out. Share the patterns and differences as a class.
Data Set Three – Optional
A third data set has been included for teachers wishing to repeat the activity in this session. The data for this set was obtained from www.censusatschool.org.nz/.
Data Set Three is a data set of 24 students. The data is: top – male/female, left – arm span in cm, right – height in cm, bottom – age in years.
Session Four
Today the students, in small groups, will design and compile their own data card set. Each small group of students will design three survey questions to ask the students in the class.
- Provide students with blank data cards and explain that each group will be collecting their own data based on four survey questions. The first survey question will be "Are you the oldest, middle or youngest child in your family?" and three new survey questions will be added by students. Discuss "issues" that are of current importance to students. For example, students might be interested in whether people think fireworks should be only used in controlled displays, whether buses should be organised to get students to school, or how many different ethnicities or languages are represented in your class. You could frame this with the context of finding out more about make-up of our class, or as learning to inform persuasive writing, speeches or community action. Take care with issues that may be sensitive, particularly those related to body image, gender identity, religion and culture.
- Discuss how to define position in the family? Oldest – no siblings older than you; Middle – have older and younger siblings; Youngest – you have older sibling(s), but no siblings younger than you. An only child would be the oldest; if there are two children then there is an oldest and a youngest, from three children onwards a middle child (or children) becomes possible.
- Discuss and brainstorm suitable survey questions. Discuss, including the measurement unit, when numeric data is gathered, For example:
- How many centimetres tall are you?
- How many centimetres across is the span of your right hand? (thumb to pinky finger)
Specific instructions will be needed with survey questions like this, so it is clear where to start and finish measuring. - How many seconds does it take you to run 100m?
- What is your favourite...?
- How many languages are spoken in your family?
A list of possible favourites to select from is best with survey questions like this. - What time did you go to bed last night, in hours and minutes?
When organising the data from survey questions like this, categories may be needed, e.g. before 8 pm, 8 to 9 pm, 9 to 10 pm, and later than 10 pm.
- Students could also look at the Census At School questionnaires for ideas of survey questions they could ask. On the explore the data page the questionnaires are available on the right hand side.
- Before starting to collect data each small group of students needs to write three anticipatory statements about what they expect to find out about the class.
- Each small group of students needs to collect information and make data cards from students in the class. The best way to do this is for each pair to create a "station" for other students to visit. The stations can be labelled with letters of the alphabet to ensure all students visit each station, like a dance card.
- Once the data cards are completed, students are to sort and arrange them to look for things of interest. The small groups of students are to prepare a brief report of the things they have found out. Ideally the report includes some display of the data which might be the data cards organised in groups or bars.
Session Five
If a further session is required, the ideas from session 4 can be repeated, or students can make up their own set of data cards by selecting a small sample of students from Census At School. To do this they would need to go to the random sampler and agree to the terms. Then select SPECIFIC variables and select four variables for their data cards. The first three sections are pretty good to choose from. Then enter sample size – 30 should be enough. Generate a sample, then an option to download the sample comes up – select this. Save their sample and then open the spreadsheet and use the information to make their own data cards.
Dear parents and whānau,
This week in maths we are gathering and investigating data about the students in our class.
You might like to ask your child to explain how data cards work. Maybe you could each make a data card like the ones we have been making at school. Discuss what things are the same and what is different about people in your whānau.