In this unit, using our fridge as the context, we collect and present data using dot plots and bar graphs. We start to learn about using the computer to display our data and explore features of data display.
- Plan a statistical investigation.
- Display data in dot plots, strip graphs and bar charts.
- Discuss features of data display using middle, spread, and outliers.
Planning an investigation at Level 3 of the New Zealand Curriculum is more complex than at Level 2. At Level 3, students refine their understanding of statistics by conducting investigations that make use of the statistical enquiry (PPDAC) cycle. PPDAC stands for problem, plan, data, analysis, and conclusion. Within this, students begin to talk about situations they have experienced, pose investigative questions, produce plans for a statistical investigation, and may utilise digital graphing and survey tools (i.e. on the computer) in their work.
In this unit the students are introduced to dot plots and bar graphs. The way in which they will need to collect and organise their data is dependent on the nature of their investigative questions. They should start to see, and be able to talk about, distinctive features of their displays such as the groupings and modes. The unit of work Planning a statistical investigation (level 3) provides a full description of all phases of the statistical enquiry cycle.
Dot plots
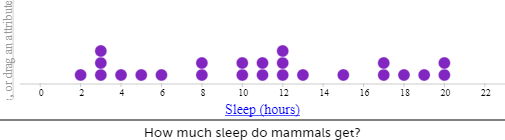
Dot plots are used to display the distribution of a numerical variable in which each dot represents a value of the variable. If a value occurs more than once, the dots are placed one above the other so that the height of the column of dots represents the frequency for that value. Sometimes the dot plot is drawn using crosses instead of dots. Dot plots can be used for categorical data as well.
Bar graphs
In a bar graph, equal-width rectangles (bars) represent each category or value for the variable. Usually, gaps are included between the bars to demonstrate the distinct, discrete nature of the categorical data (i.e. that each bar represents a different category or whole number). The height of these bars tells how many of that object there are. The bars can be vertical, as shown in the example, or horizontal.
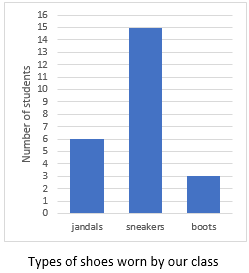
The example above shows the types of shoes worn in the class on a particular day. There are three types of shoes: jandals, sneakers, and boots. The height of the corresponding bars shows that there are six lots of jandals, 15 lots of sneakers and three lots of boots. It should be noted that the numbers label the points on the vertical axis, not the spaces between them.
The learning opportunities in this unit can be differentiated by providing or removing support to students and by varying the task requirements. Ways to support students include:
- setting up the plan for data collection for students to follow
- the type of data collected; categorical data can be easier to manage than numerical data
- the type of analysis – and the support given to do the analysis
- providing pre-prepared graph templates to support developing scales for axes
- providing prompts for writing descriptive statements
- teacher support at all stages of the investigation
- providing opportunities for students to share their learning, work in pairs (a tuakana/teina relationship may suit) or work in small collaborative (mahi tahi model).
This unit uses food and students’ fridges as a context for investigations. When implementing this unit, be aware of your students’ socio-economic backgrounds. Access to food may be a sensitive topic for some students. Therefore, this context can, and should, be adapted to suit the interests and experiences of your students. The statistical enquiry process can be applied to many topics and selecting ones that are of interest to your students should always be a priority.
Te reo Māori vocabulary terms such as tūhura (investigate), rapanga (problem) and kohikohi raraunga (data collection) could be introduced in this unit and used throughout other mathematical learning.
- Memo cube paper or sticky notes – three different colours
- Copymaster 1
- Copymaster 2
- Copymaster 3
Session 1
We begin the week collecting fridge data about our class. We use this information to start to explore new types of data displays.
- Tell the class that this week they will be investigating Fridge Pickers.
What do you think a fridge picker is?
Collect ideas from the class and record them on a hard-copy or digital chart. - Tell the class that the first thing we will investigate is What types of foods do the students in our class like to pick from the fridge? This is the investigative question (our problem).
- As part of the planning for the investigation we need to decide how we will collect the data that we need to answer the investigation question. We will use the following survey question – What type of food do you like picking from your fridge?
- Pose the investigative question to the class. List students ideas on the board and then group the answers into 5-6 categories. Make sure to include an “other” category. Emphasise that the use of categories is important. If every student contributed a different answer (i.e. which might happen without the use of categories), it would be difficult to compare the data in an in-depth manner. As a class, develop the final survey question: What type of food do you like picking from your fridge – choose from: OPTION 1, OPTION 2, OPTION 3, OPTION 4, OPTION 5, OTHER please specify _________
- Introduce the addition of another variable (i.e. a quantity to be measured) to the data set. It might be interesting to compare the favourite fridge pickings of students from different cultures, or to compare whether a student's place in their family has any effect on their favourite fridge pickings. To explore the latter idea further, data could be collected on each student's position in their family and their favourite type of food to pick from the fridge. You might discuss the following points:
- How do we define position? Eldest – no siblings older than you; Middle – have older and younger siblings; Youngest – you have older sibling(s), but no siblings younger than you.
- An only child would be a singleton or only child (more acceptable now)
- If there are two children then there is an eldest and a youngest
- From three children onwards a middle child (or children) becomes possible.
- Give students a small, coloured square of paper (or a sticky note) based on their position in the family. For example: Eldest child – yellow; middle child – green; youngest child – blue. Ask them to give the answer to the survey question: What type of food do you like picking from your fridge? They select one of the categories to either write or draw on the paper. If appropriate this could be completed digitally (e.g. with the use of Google Forms). Collect the data.
- Ask the students to sort the squares to make a bar graph (analysis). If possible, take a photo of the display, upload into a google doc or similar and capture student statements about the display.
What statements can you make about us as fridge pickers? (analysis) - If it has not come up, ask the students what they notice, if anything, about the colours in the graph. Maybe rearrange the squares so that the same colours are together in each of the stacks. Take a picture of the new display and add to the document.
Does the display show us anything different? - Rearrange the squares so that the same colours are together in a bar graph. What does this now show us? The distribution of position in the family. What do you notice about this graph? (Take a picture of the new display and add it to the document). E.g. More people are the youngest in their family in our class than are the eldest in our class.
- Sort the squares in the family position stack into groups by the type of food they like to pick. (Take a picture of the new display and add it to the document). How is this display different to the one we had when we had sorted by type of food? Does it give us any different information?
- Communicate findings (conclusion). Refer to the investigative question at the start: What types of foods do the students in our class like to pick from the fridge? and write and answer based on the findings from the explorations above. Give the students the opportunity to discuss their findings with a buddy.
Preparation for data collection for a home-based activity
- Ask:
How many people in your family do you think are fridge pickers?
What time of the day do you think people fridge pick?
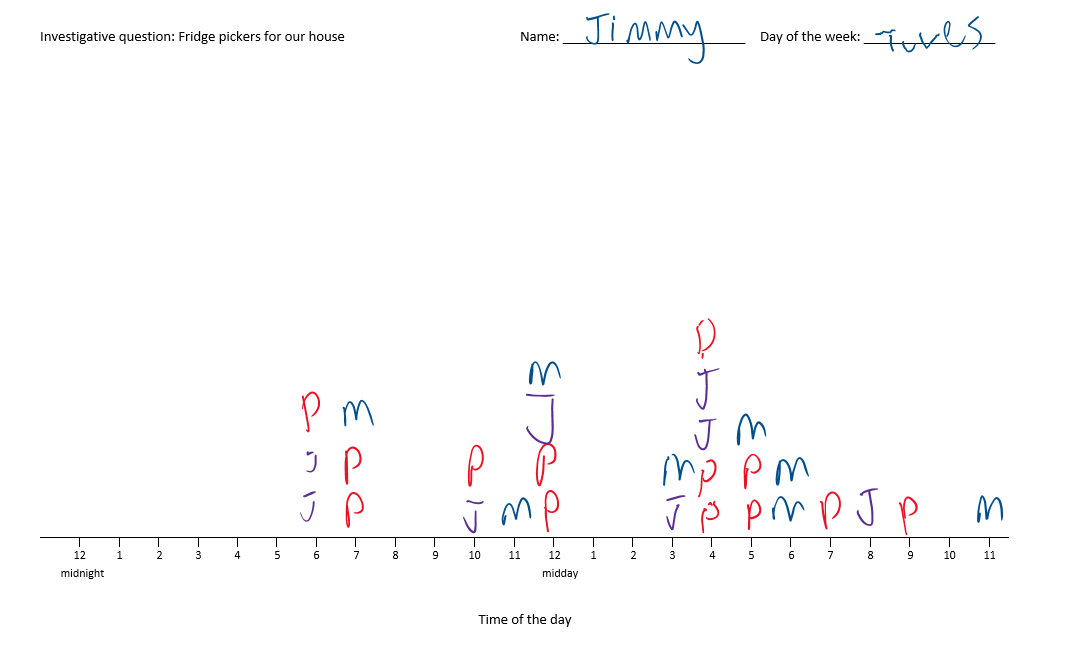
How could we find out? - Show the students the Fridge Pickers (Copymaster 1) dot plot and highlight its features. Explain that they are to use it at home one day this week to investigate fridge pickers. Each time a person opens the fridge to pick they are to put a X beside the time. If you want to add individual detail, ask each member of the family to use a different coloured pen or to write their Initial instead of a X. The dot plots are to be brought to school for the activity in session 5.
- As a class, make predictions about the information they will gather.
We think that:
Our fridges will be opened the most before teatime.
That no one will open the fridge between midnight and 6 am. - Ask each child to write an additional 1-2 statements about who they think will open the fridge the most in their home and when the most popular times will be.
Sessions 2-4
Over the next three days the students gather information around the theme of fridges or food. They will collect and record the data in a spreadsheet or data table in a software package that allows them to draw statistical displays. In this unit we use CODAP, but other software tools can also be used. Look for tools that allow students to access the raw data (i.e. one row containing the responses for each person or object they collect data on) rather than needing summarised data. Using the statistical graphing tool students will display the information using dot plots and bar graphs, and make statements about what the data shows. If you do not have access to computers then provide students with blank templates to make their dot plots (Copymaster 2) or bar graphs (Copymaster 3).
PROBLEM: Generating ideas for statistical investigation and developing investigative questions
- Brainstorm ideas for other fridge or food investigations. List these on the board. Some ideas could include:
- What drinks do we keep in our fridges?
- What type of fridges do we have?
- What types of yoghurt do we like?
- What types of vegetables and meat do we keep for boil ups?
- What are our favourite leftovers in the fridge? For example, paua patties from the day before, cooked titi, food from the hangi, or toroi (prepared fern fronds) or even raw oysters?
- What special-occasion food do we find in the fridge around certain times (e.g. Christmas, Matariki, birthdays).
- What brands of margarine do we prefer?
- Let the students work in pairs to investigate using the PPDAC cycle. Consider pairing together students of mixed mathematical abilities to encourage tuakana-teina. Ask the students to select a topic. You may choose to provide a list of appropriate and/or relevant topics to encourage purposeful investigations. If two or more pairs want to do the same investigation, let them do so. When it comes to sharing findings, remember to compare results.
- Students develop an investigative question(s) based on their topic. These are the questions they ask of the data; it will be the question(s) we explore using the PPDAC cycle.
Prompts to help with posing investigative questions include:- What is the variable that you want to ask about?
- Describe the group that you are asking about.
- Do you want to describe something (summary) or compare something (comparison)?
- Summary questions have one variable and one group e.g. What types of fridges do we have? [type of fridge, we (our class)]; What brands of margarine do the students in Room 23 prefer [preference of margarine brand, students in Room 23]?
- Comparison questions have one variable and two or more groups e.g. How do the types of yoghurt our class like compare with the types of yoghurt Room 21 like?
- Check the investigative questions that students have posed. Gather them in e.g. write on the board, type into a google doc or write on paper to be pinned up. As a class check each investigative question for the variable and the group and the remaining criteria:
- Is the question purposeful?
- Is the question about the whole group? Check that it is not just finding an individual or smaller group of the whole group.
- Is the question one that we can collect data for?
- Is it clear that the question is a summary investigative question or a comparison investigative question?
- Get students to make a prediction about what they will find as a result of their investigation.
PLAN: Planning to collect data to answer our investigative questions
- Students need to develop survey questions to answer their investigative question. For example, if they are exploring the investigative question What are the types of fridges we have? they will need to get information to answer this question.
- Survey questions are how they get the information. In thinking about their investigative question, the students decide they want to find out about the make and the style of the fridge. They pose two survey questions: (1) What is the make of your fridge? and (2) What type of fridge do you have? In discussion with another pair at their table they wondered about what would happen if people had two fridges because one of the students at the table said they had a fridge in the kitchen and one in the garage that was used for drinks and extra food. They decided to add to their survey questions – if you have more than one, pick the one that is your main fridge.
- Once the students have developed their survey questions they should list some options for people to choose from:
For example: Make of fridge question – using the internet they found 15 different makes of fridges so they picked six that they knew and added an “other” category.
Categories: Fisher and Paykel, Haier, LG, Samsung, Simpson, Westinghouse, Other Type of fridge question – using the internet they found the following categories for refrigerators: All refrigerator, Top (freezer) mount refrigerator, Bottom (freezer) mount refrigerator, single-door refrigerator with freezer capacity, Side by side refrigerator, French door model refrigerator, other. Finally, the students need to prepare instructions to indicate how others are to respond to their survey questions. At this stage they should also think about how to collect the data, for example using a table to record responses or a digital survey tool (e.g. Padlet, Google forms).
Your name Q1. What is the make of your fridge? If you have more than one, pick the one that is your main fridge. Choose from:
- Fisher and Paykel
- Haier
- LG
- Samsung
- Simpson
- Westinghouse
- Other – please specify
Q2. What type of fridge do you have? If you have more than one, pick the one that is your main fridge. Choose from:
- All refrigerator
- Top (freezer) mount refrigerator
- Bottom (freezer) mount refrigerator
- Single-door refrigerator with freezer capacity
- Side by side refrigerator
- French door model refrigerator
- Other – please specify
- To check the clarity of the survey questions and instructions have pairs exchange and check one another’s.
Read the directions.
Are they clear to you?
Can you tell what you are supposed to do?
What do you think they need to change to make the directions clearer? - Allow time for the survey questions and instructions to be modified.
DATA: Collecting and organising data
Tell the pairs to leave their instructions and tables to record the responses at their desks. This could be in paper format or electronic. Electronic versions could be set up directly in a spreadsheet (e.g. Google Sheets, MIcrosfot Excel) or on a digital document containing a table (e.g. Microsoft Word, Google Docs). Give students time to complete each others' surveys.
Your name Q1. What is the make of your fridge? If you have more than one, pick the one that is your main fridge. Choose from:
- Fisher and Paykel
- Haier
- LG
- Samsung
- Simpson
- Westinghouse
- Other – please specify
Q2. What type of fridge do you have? If you have more than one, pick the one that is your main fridge. Choose from:
- All refrigerator
- Top (freezer) mount refrigerator
- Bottom (freezer) mount refrigerator
- Single-door refrigerator with freezer capacity
- Side by side refrigerator
- French door model refrigerator
- Other – please specify
Melino Simpson Bottom mount Ngaire Fisher and Paykel Bottom mount Wiremu Fisher and Paykel Bottom mount Tui LG French door model Anna Haier Side by side Jimmy Other – Daewoo Top mount Jackson Fisher and Paykel Side by side - After the surveys have been completed the pairs return to work with the data collected.
- If an electronic means of collecting the data was not used, get students to enter the data collected into a spreadsheet or a data table in CODAP. A simple way to do this is using the table tool in CODAP. See this video on how to do this. If students already have the data in a spreadsheet see this video on how to import data from a spreadsheet into CODAP.
ANALYSIS: Making and describing displays
An introduction to using CODAP as a tool for statistical investigations is explained in full in Planning a statistical investigation – level 3 (session 5).
As mentioned earlier if you do not have access to computers then provide students with blank templates to make their dot plots (Copymaster 2) or bar graphs (Copymaster 3).
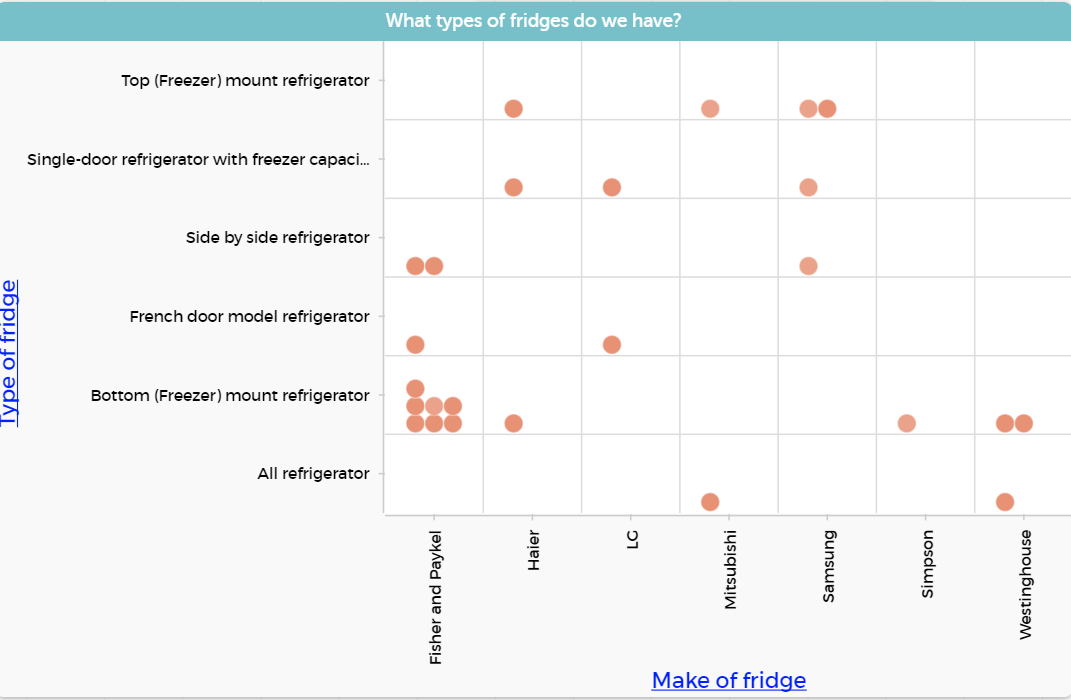
Possible examples of the types of information students can get on CODAP is below. In these examples the investigative question What are the types of fridges we have? is explored by graphing the two variables separately and then combined.
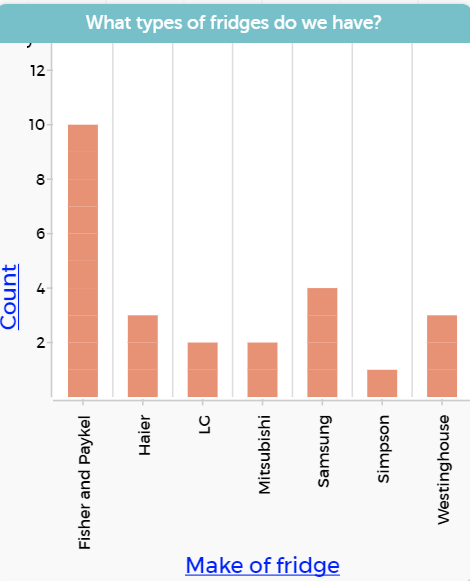
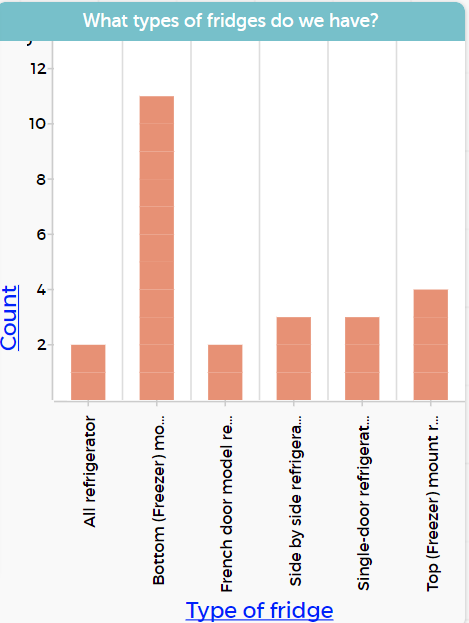
These first two graphs show the make and then the type of fridge. Because we are using technology, we can also quickly explore the combination of the two variables.
Once students have generated their graphs, they can start to describe the displays.
To describe the display, encourage students to write “I notice…” statements about their displays. If students are not sure what to notice the teacher can prompt further statements by asking questions such as:
- What do you notice about the most common …?
- What do you notice about the largest number… the smallest number…?
- What do you notice about where most of the data lies…?
- What do you notice about the most popular… least popular…?
- What do you notice about the type of fridge for Fisher and Paykel compared with the type of fridge for Mitsubishi (more specific example for a comparison) …?
Check the “I notice…” statements for the variable and reference to the group. For example: “I notice that the most common make of fridge for our class in Fisher and Paykel.” This statement includes the variable (make of fridge) and the group (our class). Support students to write statements that include the variable and the group.
CONCLUSION: Answering the investigative question
- Discuss with students the features that you want them to include in their report (or poster) of the statistical investigation. The reports could include:
- Their investigative question .
- What they predicted they would find as a result of their investigation.
- A description of how the data was collected, including their survey questions and any decisions they made and why.
- The data displayed using bar graphs and/or dot plots.
- A written description of the data and an answer to their investigative question.
- Display the completed investigations. Give the students time to look at the other investigations before discussing.
Tell some of the things you learned from the investigations. What are the preferences of students in our class?
What was the most popular choice in your survey?
How can you tell?
How many students made that choice?
Which display is most effective?
Did you have any unexpected results? - Compare investigations completed by more than one pair.
Do these displays look alike?
Did the two surveys have the same choices for you to make?
What differences are there between the investigations?
Session 5
In today’s session we use the data we have gathered at home to examine our initial predictions about fridge pickers.
- We begin this session by looking at the dot plots that the students have created at home.
What can you say about your chart?
Which times of the day are the busiest for fridge pickers? Why?
Which times of the day are the quietest? Why?
Who opens the fridge the most often in your home? - Ask the students to make a poster displaying the results of their fridge picker investigation. List the requirements for the poster for the students to complete, for example:
- Display your data using a dot plot
- Label your dot plot
- Give your poster a title
- Make three statements telling things you have learned about the fridge pickers in your family.
- Discuss ideas for making a classroom display of the posters.
Dear parents and whānau,
This week at school we are carrying out investigations and making displays of data using dot plots and bar graphs.
For one day at home this week we would like your family to keep track of how often your fridge gets opened. To do this, ask people to put their initials above the nearest hour each time that they open the fridge. We will be looking at these dot plots at school on ___________.
Provide Copymaster 1.