The purpose of this unit is for students to use games to gather and present data in a systematic way. In turn, this allows them to determine the likely outcomes of some everyday events.
- Investigate, state and justify the probability of events in common situations.
- Theoretically and experimentally examine the probabilities of games of chance.
The unit provides an introduction to probability, the measurement of chance. Just like 2.3 metres is a measure of length, 50% (or 1/2) is a measure of the chance of getting heads with a single coin toss.
Probabilities range from zero to one (0-100%). An event that always occurs is certain and has a probability of 1 or 100%. An event that never occurs is impossible and has a probability of 0 or 0%.
There are two ways to estimate or calculate the probability of an event occurring. An experiment consists of trials where the event may occur. For example, a dice might be rolled 100 times and the results used to estimate the probability of heads occurring. The experimental probability is unlikely to be exactly 50% but the results will provide an approximate measure for the likelihood.
The likelihood of some events can be worked out theoretically. A model must find all the possible outcomes and identify which of the outcomes leads to the event occurring. The probability is expressed as a part-whole fraction: Number of outcomes that lead to the event/Total number of possible outcomes. In the simple case of a coin toss there are two possible outcomes, and one of those outcomes leads to the event of heads. Therefore, the probability of heads equals 1/2.
In more complex situations involving chance, models of theoretical probability become more complex. Events are independent if they do not influence each other. Tossing two separate coins involves independent events as the result from the first coin has no impact on the result from the second coin. Selecting two coloured pegs from a bag without replacement involves two dependent events. The result of the first peg draw affects the possible outcomes for the second peg draw.
The learning opportunities in this unit can be differentiated by providing or removing support to students and by varying the task requirements. Ways to support students include:
- connecting the drawing of diagrams and acting out of situations as strategies to represent how all the possible outcomes can be found. For example, you can simulate creating totals from rolling two dice by using dice of different colours. Roll one dice, then the other, and record the outcome as arms on a tree diagram or in a table
- clarifying the language of probability, particularly words like ‘chance’, ‘likelihood’, 'impossible', 'certain', and more technical terms such as ‘experiment’, ‘trial’, and ‘theoretical’
- encouraging students to work collaboratively so they can share their knowledge, be extended by their peers, and scaffold each other
- modelling efficient ways to record the results of trials, especially with the use of tally charts and frequency tables
- modelling ways to find all the possible outcomes, such as using tables, networks, and systematic lists
- easing the calculation demands by providing calculators, particularly for converting among fractions, decimals, and percentages.
The context for this unit can be adapted to suit the interests and cultural backgrounds of your students. Most students are captivated by games of chance and are intrigued when their expectations about fairness do not match what occurs. This unit uses dice and card games as the primary context. Story shells can be added to make the context more engaging for students, such as framing the games in a television gameshow, or in a legend where the main character makes a difficult decision.
Te reo Māori kupu such as tūponotanga (chance, probability), putanga (outcome), whakamātau tūponotanga
(probability experiment), whakamātau (test, trial, experiment), putanga tātai (theoretical outcome), and hoahoa rākau (tree diagram) could be introduced in this unit and used throughout other mathematical learning.
- Gameboard
- 2 dice
- Counters in two different colours, one for each player
- Ten cards from a suit from the ace = 1, to the 10
Getting Started
Beat-it
- Pose the following problem for discussion by the students, perhaps in groups of four.
What does the word “chance” mean?
Can you think of situations in your life where chance is involved? - Ask the students to record their responses. Make a working definition of chance with key words like” Possibly/ Possible, luck, likelihood/likely, 50:50, never/sometimes/always.” Confirm the definition of chance as “The possibility of something happening.”
- Discuss the 'chance' of different situations occurring - such as the chance of winning a game, of it raining tomorrow, of getting what you want for Christmas, etc. You might relate this discussion to a current world event (e.g. the chance of New Zealand winning a gold medal in cycling at the Olympics) or to a situation that relates to the context, cultural backgrounds, and interests of your students.
- Introduce the game Beat-it as described below and focus on the necessity to make a choice – an important choice as it determines whether, or not, you can continue in parts of the game.
Players need two dice and a grid drawn up like the one below:
| B | E | A | T | I | T |
- The game begins by focussing on the left hand column and progressing through the other 5. To participate in the game all students need to be standing. Any time throughout the game they can choose to sit down.
- Roll the pair of dice and call out the two numbers. Each player sums the number together and records the answer in the first column. Therefore, if a 3 and a 5 were thrown the students would record an 8 in the first column.
- Before the next throw, players decide whether to remain standing or sit down. If they sit down, they add up the total of the scores in the first column to give a total for that column. In our game that means they would end up with 8 as their total. If they choose to stay standing, they can record the next total to the first column.
- If at any time, other than the very first throw for each column, a total of 7 is thrown, all scores in that column are wiped and the column total goes to 0.
- The game continues for each column until there are no more players, i.e., all the students are seated - either by choice or be being wiped out with a 7. The procedure is repeated for each of the columns. When the game is completed, all the totals of the 6 columns are added together to give the final score.
| B | E | A | T | I | T | |
8 6
| 4 5 5 7 | 6 8 9 10 5 | 3 6 5 7 | 2 11 8 9 12 2 5
| 5 3 9 5 12 7 | |
| Totals | 14 | 0 | 38 | 0 | 49 | 0 |
Grand total = 101
- Play the game with the students and discuss the various strategies used when deciding when to sit down.
- These might be recorded so that they can be used for future games.
This is an example of a set of class grand totals displayed as a stem and leaf graph.
| 5 | 4 |
| 6 | 0 9 |
| 7 | 1 1 3 5 7 |
| 8 | 5 5 8 9 2 |
| 9 | 4 7 8 |
| 10 | 1 5 7 9 9 |
| 11 | 7 9 2 |
| 12 | 6 |
| 13 | 2 |
- Pose questions to the students that focus them on the clustering of the results, the range of the results, and on any outliers. For example:
What does this group of numbers tell you about the game?
Were our results reasonably close?
How might these (outliers) be explained? - Discuss with the students how they could manipulate the data on the graph so that a mean, median, or mode could be found as a measure of centre. You might need to review or teach the students about these measures of centre. Consider their prior knowledge. This might provide an opportunity for explicit teaching around these measures of average.
What strategies could be used to get the highest score?
Students might suggest a “Hold until a given score is reached on each round” strategy or “Hold until a set number of throws is up” strategy. Others might suggest a “gut feel” strategy in which players hold until “they feel it is time to bank the points.”
What score should you go to before you bank the points?
How many throws should you take until you bank the points?
What influences your feelings about banking the points? - Discuss with the students how an improvement in overall class performance might be reflected on the stem and leaf graph. Create a stem and leaf graph.
- Repeat the game and compare the results by comparing stem and leaf graphs or by using back-to-back stem and leaf plots. Performances may get better over a week-long period. Invite students to experiment with strategies to see how those strategies influence the total score (You might start each mathematics session that week with the game.)
- Explore the mathematics that might help students in developing or confirming a optimum strategy. In pairs, give the students a pair of dice and ask them to devise an experiment that will give them an indication of how often a sum of 7 will appear. Organise these groupings strategically to encourage tuakana-teina (peer learning) and effective learning conversations. Students may conduct and experiment or produce a tree diagram or table to represent all the outcomes. The students can express their probability of 7 as a fraction, decimal or percentage (1/6 = 0.16 = 16.6%). Again, you may need to provide explicit teaching around the constructions of such diagrams and tables.
- Now you know the chances of going out with nothing are 1/6 each two-dice roll, does that change your mind about winning strategy? Why?
Exploring
- The next game is called Who Removes Wins. The aim is to introduce more systematic way of determining possible outcomes and using those outcomes to determine probabilities.
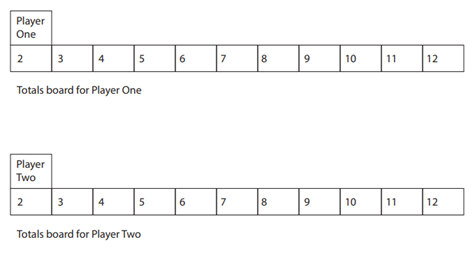
Players will need:- Copies of the game board big enough to house counters in each cell (Copymaster 1).
- 40 Counters in two different colours, one colour for each player.
- 2 dice between two students.
- Copies of the game board big enough to house counters in each cell (Copymaster 1).
- Who Removes Wins is played in pairs. Each player is given 20 counters to place on numbers on their game board. They can place as many counters as they want on each number. However, each number must have at least one counter.
- Players take turns to throw a pair of dice and add the numbers. If their total on the board has counters remaining on it, they can remove ONE counter from that number. The first person to remove their counters from the board wins.
- Tell the students to play the game in pairs and write some questions that they might want to ask about the probabilities of the game:
- What do the popular totals seem to be?
- Where on the board are the totals that don’t seem to occur very often?
- Why might some totals occur more often than others?
- If you were to play the game again, where would you place the counters?
- Play the game again trying to place the counters in the "best" places. After the students have played ask them to comment on the effectiveness of their placements.
- Pose the question:
How can we determine the likelihood of different totals?
Discuss the need to have a "reasonable" number of trials and the ways that you could keep track of the totals. - Get each pair to roll the two dice 36 times and record the results on a class chart or spreadsheet. Determine the percentages for each total.
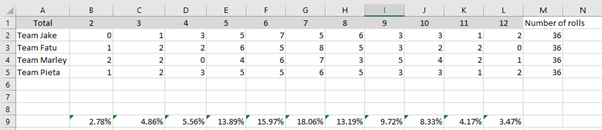
- Discuss the data.
What patterns do you see? Explain why some numbers occur more frequently than others? - Set up this scenario:
Two students are having a debate about the number of different ways or combinations of getting a total of seven. Garry reckons there is only three ways of getting the total. Jackson thinks there are six.
What is the reasoning behind Garry and Jackson's thinking?
How might you help Garry and Jackson settle their debate? - Let students take a position by discussing the views of Garry and Jackson in pairs.
Do they recognise that Garry thinks that order in unimportant? Garry has the ways to make seven as 1 + 6, 2 + 5 and 4 + 3.
Do they recognise that Jackson thinks order is important because there are two different dice? Jackson has the ways to make seven as 1 + 6, 2 + 5, 3 + 4, 4 + 3, 5 + 2, and 6 + 1.
Discuss who is correct, Garry or Jackson. You may need to act out the six ways a total of seven can be made using the dice. Dice of two different colours help as Red 3 and White 4 looks different to Red 4 and White 3. - Show the students this table of possible outcomes for Who Removes Wins.
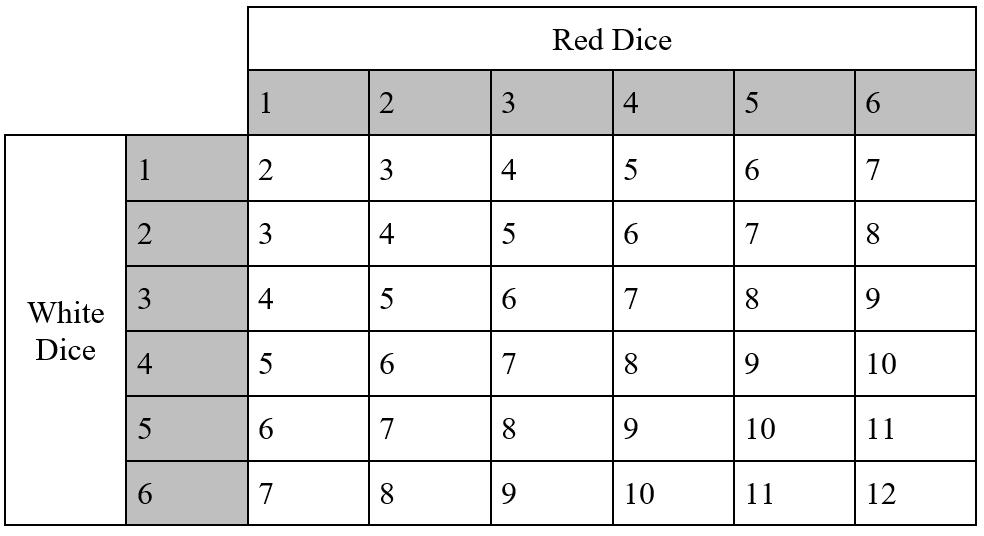
What does the table represent?
How does the table explain the patterns you saw from your games of Who Removes Wins?
Imagine you took 36 throws of the two dice. How many of each total would you expect? Why?
Do you think you will get exactly what you expect, or will there be some difference? Why? - As a challenge, ask the pairs to make up a fair game by changing the numbers on the dice.
Is it possible to have two dice that give an equal probability of the totals?
A nice solution is dice labelled 0, 0, 0, 6, 6, 6 and 1, 2, 3, 4, 5, 6.
Let students devise their game and convince another group that their game is fair.
Application Game
- This section provides a situation where the students can apply some of the ideas they have developed in the unit so far.
- Begin with a discussion of the term "fair" and what it means to be fair. For example:
What is a fair game or result? How would you decide if a game was fair?
Should all games be fair?
What might be a good meaning for the term fair when analysing different games? - Introduce the game Winning Differences. Allow the students to work in pairs and ask them to analyse the game using ideas developed over the unit. One requirement of their investigation is to check the fairness of the game. If it is not fair, they must provide some suggestions supported by evidence.
- To play Winning Differences students need:
- 1 Dice
- Ten non-picture cards from a suit from ace (1) to 10.
- To play:
Place the cards face down in the centre. Each turn consists of throwing a dice, choosing a card, and taking the difference of the two numbers.
Player 1 wins if they get a difference of 0, 1, 2, 3, 4.
Player 2 wins if they get a difference of 5, 6, 7, 8, 9.
Is the game fair? If not, how can it be made fair?
Reflecting
- In the final session recap the games that have been played and try to work out the probabilities of success theoretically.
How can we be sure what are the best places to put your counters in the game of Who Removes Wins?
What is the probability of winning in the game Winning Differences?
Was Winning Differences fair?
Can you justify your position? How can we be sure what are the best places to put your counters in the game of Who Removes Wins?
What is the probability of winning in the game Winning Differences?
Was Winning Differences fair? Can you justify your position? - Give the students a challenge:
Using any of the dice and or the cards, make up a game of your own.
Try it out with other students in the class, making any changes needed until it is a fair game.
Dear parents and whānau,
This week in maths we have been playing games!
We have been studying the chance or probability linked to each game to see if we could find winning strategies. We have also looked at the games to see if they were fair. Play a game of Winning Differences with your child and help them think about whether the game is fair or not.
Home Activity
Winning Differences
You will need:
- 1 Dice
- Ten cards from a suit from the ace = 1, to the 10
Rules:
Place the cards face down in the centre. Each turn consists of throwing a dice, choosing a card, and taking the difference of the two numbers.
Player 1 wins if they get a difference of 0, 1, 2, 3, 4.
Player 2 wins if they get a difference of 5, 6, 7, 8, 9.
Is the game fair? If not how can it be made fair?