In this unit students investigate ways of systematically counting all the possible outcomes of an event. One particular approach is investigated: using tree diagrams.
- Systematically find all possible outcomes of an event using tree diagrams and organised lists.
Students need a knowledge of probability to understand consumer reports, surveys and samples. Nearly all activity in the working world requires making decisions in uncertain conditions on the basis of making sense of data.
Probability is the measurement of chance. Consider a game that involves tossing three fair coins. Heads or tails are the two possible outcomes for a single coin toss. Therefore, fair means that the coins have an equal likelihood of landing on heads or tails. A win occurs if all three coins land the same way, i.e. three heads, or three tails. The probability of a win can be expressed as a fraction. The numerator is the number of favourable outcomes and the denominator is the total number of possible outcomes. Probability always measures a part-whole relationship of outcomes so cannot be greater than one.
All the possible outcomes might be worked out by systematic listing or tables, but a tree diagram is a tidier method.
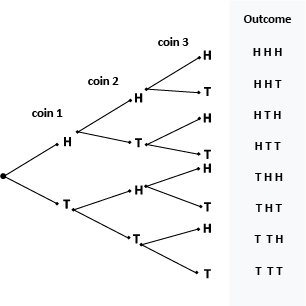
From the tree diagram above we see that the eight possible outcomes are HHH, HHT, HTH, HTT, THH, THT, TTH, TTT. The total number of outcomes is eight. Only two of those outcomes match the event that all three coins land the same: HHH and TTT. The probability of three the same equals 2/8 or 1/4. That same fraction might be expressed as 0.25 (decimal) or 25% (percentage).
Further background on probability can be found on page 43 of Teaching Number through Geometry, Measurement, Algebra and Statistics.
The learning opportunities in this unit can be differentiated by providing or removing support to students, or by varying the task requirements. Ways to support students include:
- providing physical materials, such as spinners, coins, and dice, allows students to conduct experiments with. Trialing often gives students appreciation of the situation before they think about all the possible outcomes
- explicitly modelling the drawing of tree diagrams and tables, and the writing of systematic lists of outcomes. Possibilities shown on the diagrams can be linked to the specific outcomes of a trial
Tasks can be varied in many ways, including:
- manipulating the complexity of the situations that students are asked to work with, e.g. less options at each stage
- allowing flexibility in the way students find all the outcomes
- providing opportunities for students to work in a variety of collaborative groupings (e.g. whole class, pairs, small groups) so students can learn from each other and benefit from opportunities to share, justify, and listen to a range of ideas
The contexts for this unit can be adapted to suit the interests and cultural backgrounds of your students, and to make connections to learning from other curriculum areas. Look for everyday examples when your students deal with probability. Students might choose four different elements to make borders around a tapa cloth. How many orders are possible? They might consider how many different ways the events in a triathlon or tetrathlon can be ordered, if the events are chosen randomly, e.g. cycling, swimming, running, skiing. If students are interested in music, explore how many different progressions are possible with four bar chords, say G, C, D and A. What are the chances that a progression sounds like a well-known waiata? Students may also be interested in games such as Yahtzee or Eucher, in which chance affects the outcome of the game.
Te reo Māori kupu such as hoahoa rākau (tree diagram), pāpono (event, probability), tūponotanga whakamātau
(experimental probability), and tuarangi (variable) could be introduced in this unit and used throughout other mathematical learning
- Prepared spinners
- Coins
- Paper clips
- Sharp pencils
- Copymaster 1 and 2 (and answers)
- Spinners learning object
Getting Started
- We begin the unit by playing the game Odds and Evens. This uses a spinner divided into thirds with the segments labelled 1, 2 or 3. You can use Copymaster 1 or make your own.
Odds and Evens
Players (in two teams or pairs) take turns spinning the spinner twice.
One player (or team) wins if the sum of the two numbers is even.
The other player or team wins if the sum is odd.
- Before the students start playing the game ask:
What does the word fair mean? (some notion of balance in the chance of winning)
Do you think this is a fair game?
Why or why not?
How might we work out if the game is fair? - Look for students to express ideas about each player having the same chance of winning. Some students might suggest finding out all the things (outcomes) that might happen and assigning win (or loss) to the appropriate player.
- Let the teams or pairs play the game keeping track of the number of wins for Player Odd and for Player Even.
Ten games per pair of students will generate a lot of experimental data (i.e. data that comes from the results of an experiment). Discuss the results and the students’ ideas about fairness. Record some of the results in a table:
| Team | Odd wins | Even wins |
| A | 4 | 6 |
| B | 5 | 5 |
| C | 6 | 4 |
| D | 2 | 8 |
| E | 5 | 5 |
| F | 7 | 3 |
| G | 3 | 7 |
| H | 4 | 6 |
- Discuss the experimental results.
What do you notice about the results? (Students should notice that the results vary a lot as the sample of ten games is quite small)
Why does this variation happen? Is it expected? (Students might offer ideas about the consistency of the spin, the unpredictability of chance, small number of games)
How did you decide if the game was fair?
Why do some think it is fair and others think it isn’t fair? Can it be both?
Are we better to leave the data in team groups like this or combine it? What difference might combining the data make? - You might pool the class data and get a result like: Odd (69 wins) Even (81 wins).
Is the game fair? How can we tell? (There may be a minor imbalance in favour of even) - Deciding if the game is fair or not should lead to the idea that to predict fairness you need to know all possible outcomes, that is, all possible totals of numbers on the two spinners. From this you can see how many are odd and how many are even.
How could we find all possible outcomes?
Share ideas. Model the creation of a tree diagram for all the possible outcomes. You might start the diagram and expect students to complete it, or model the creation of one tree diagram and then ask students, in pairs, to create one.
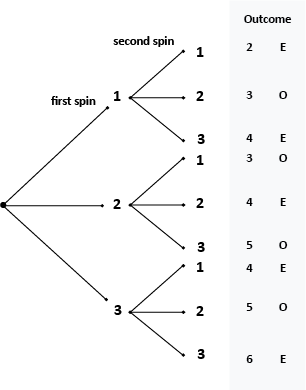
- First list the possible outcomes of the first spin, (1, 2, 3).
- Next decide how many outcomes are possible for the second spin and draw that number of branches from each of the outcomes of the first spin.
- Next calculate the sum at the end of each branch.
- The sums can now be separated into even and odd numbers giving 5 even and 4 odd. Therefore, the game is not fair. Over a long series of trials (games) you would expect to get an even sum more often than an odd one.
- Record the probabilities as fractions; Probability of Even total = 5/9 and Probability of Odd total = 4/9.
- Discuss:
What fraction does 5/9 + 4/9 add to? (9/9 which equals 1). Why 1? (The whole in this situation is the total number of outcomes, 9, and those outcomes are split between Even win and Odd win) - Conclude by asking how the game might be altered to make it fair. Students might suggest a spinner with numbers 1, 2, 3, and 4 in quarters.
Would that work? Show all the possible outcomes of two spins on that spinner.
Students might also suggest changing some rules.
Would taking three spins instead of two make any difference to fairness?
Exploring
Over the next 2-3 days give the students the following problems to solve. Adapt the problems to relate to the cultures, interests, and context reflected in your class. You might introduce the problems lesson-by-lesson or set them out as stations to visit. In either case ensure that a plenary is held at the end of each lesson to share ideas. You should provide modelling, feedback, and small-group and/or individualised teaching to support students to successfully engage in all of the problems presented. Encourage students to justify their solutions and their selection of method for counting all the possible outcomes. Ask students also to record the probabilities, associated with each of the problems, as fractions (decimals and percentages as extension). Printable versions of the problems are available as Copymaster 2. You can also download a printable version of the answers.
Problem 1: Sam’s Sandwich
Every morning Sam makes his own sandwich. He can use brown or white bread and can choose between honey, cheese, Vegemite, lettuce, or tomato.
How many different sandwiches can Sam make with one filling?
If Sam makes each possible sandwich equally often, what is the probability that he makes a white sandwich with honey for lunch today?
Problem 2: Pete’s Pizza
At Pete’s Pizza there is a special on. You can choose two toppings on your pizza. One single choice has to be made from the ham, mushroom, pepperoni, and bacon bins, while the other single choice has to come from the pineapple, tomato and extra cheese bins.
How many different pizzas are possible with 2 toppings?
If people choose the toppings at random, what’s the probability that Pete will sell a bacon and tomato pizza next?
(Random means that the choice of each topping is equally likely.)
Problem 3: Coin Tossing
Georgia is captain of her netball team and always selects heads at the start of the game.
What is the probability that she will win the toss for the next four games?
Problem 4: Licence Plates
In Botutuland, car licence plates have two letters and four digits. If all of the 10 digits can occur in any one of the four spots how many different licence plates are possible?
If all the licence plates are being used, what’s the probability of a Botutulandian seeing a licence plate with 0000?
Problem 5: Travel
Laura can travel from her home to the city by train, ferry or bus. Then she can walk, taxi or cycle from the transport terminal to her office.
How many different ways can she travel from her home to her office?
If she is just as likely to select any of the transport types what is the probability that she will travel by ferry and then walk to her office?
Problem 6: Sports
At Tim’s school, students can chose one sport from cricket, surfing, tennis, or touch rugby in the summer. They can choose one sport from soccer, hockey, rugby, or basketball in the winter. How many different sports combinations are possible?
Imagine that players drew the sports randomly, like out of two hats, and each sport had the same chance of selection.
What is the probability that Tim plays only sports that involve a round ball?
What is the probability of Tim not playing rugby?
Problem 7: Spinners II
Mala has a spinner that is divided into quarters with the numbers 1, 2, 3, 4 separately on each quarter. She plays the odd and even game with her friend Erik. Is this a fair game?
What event(s) has probability 10/16?
(An event is a particular outcome set, like an odd total, or an even total, or a total greater than three.)
Problem 8: Spinners III
Mala has a spinner that is divided into quarters with 1s in two of the opposite quarters and 2 and 3 in the other two quarters. She plays the odd and even game with her friend Erik. Is this a fair game?
Problem 9: Spinners IV
Mala has a spinner that is divided into quarters with 1s in two of the opposite quarters and 2 and 3 in the other two quarters. She and her friend Erik spin the spinner twice and add the scores of the two spins. In this game you win if you get a total that is divisible by 2. Is this a fair game?
Problem 10: Spinners V
Mala has a spinner that is divided into quarters with 1s in two of the opposite quarters and 2 and 3 in the other two quarters. She plays the following game with her friends Erik and Nelio. The scores of two spins are added. Mala wins if the sum is divisible by 3; Erik wins if the sum has a remainder of 1 when divided by 3; and Nelio wins if the remainder is 2 when the sum is divided by 3. Is this a fair game?
Answers
Problem 1 Answer:
Sam has the choice of 2 breads and 5 fillings. He has the choice of 2 x 5 = 10 different sandwiches.This can be solved using a tree diagram that first has 2 branches (one for each of the bread types) and then 5 branches at the end of the first branches (one for each of the fillings). This will give 10 ends to the tree.
Now a white sandwich with honey is just one of the ten possible sandwiches. So the chances of Sam making that particular sandwich is 1/10.
Problem 2 Answer:
For the pizza you get a choice of 4 from one bin and 3 from the other. Hence there are 12 possible pizzas with two toppings, one topping coming from each bin.
The bacon and tomato combination just one of the 12 possible pizzas, so the chances of that pizza are 1/12.
Problem 3 Answer:
If you construct the tree here you start off with two branches and you add two branches at the end of each branch until four lots of branch levels have been added. This gives 16 possible outcomes. Only one of these is all heads. So the probability that she wins four calls in a row is 1/16.
Problem 4 Answer:
It should be pointed out that this problem is a little hard to do by a tree diagram. First of all there are 10,000 possible numbers that can be used (going from 0 to 9999). Now there are 26 letters that can go in the first letter position and 26 for the second. Altogether there are 26 x 26 x 10,000 = 6,760,000 number plates.
Now there are 26 x 26 = 676 number plates with all zeros. So the probability if seeing one of these is 676/6,760,000 = 1/10,000. (You probably wouldn’t see one of these very often in Botutuland.)
Problem 5 Answer:
Laura has 3 ways of getting to the city and then 3 ways of getting to the office. Therefore she has 3 x 3 = 9 ways of getting to work.
The probability of going by ferry and then walking is 1/9.
Problem 6 Answer:
Tim has 4 x 4 = 16 choices of sports. He has a choice of 2 round-ball games in summer and 3 in winter for a total of 6 combinations. Hence his chances of playing a round-ball game is 6/16 = 3/8
There are 3 sports that are not rugby in summer and 3 sports that are not rugby in winter. Since 3 x 3 = 9 he has a 9/16 chance of not playing any rugby.
Problem 7 Answer:
There are 16 outcomes here and 8 of them are even. The game is fair.
One way of getting a probability of 10/16 is to take the event ‘the sum is less than 6’. But ‘more than 3’ works equally well. But there are other possibilities.
Problem 8 Answer:
Here 10 of the 16 outcomes are even. So it is best to be even. This is definitely not a fair game.
Problem 9 Answer:
There are only 5 outcomes here out of 16 that have a number divisible by 3. Hence this is not a fair game.
Problem 10 Answer: This is not a fair game either. There are 5 sums divisible by 3; 5 sums with a remainder of 1 when divided by 3; and 6 with a remainder of 2 when divided by 3. So it is better to be Nelio.
Incidentally, since there are 16 outcomes here and 16 is not divisible by 3, then there is no way that this game could be fair.
Reflecting
In today’s session the students work in pairs to make up their own outcomes counting problems for other students to solve.
- Introduce the session by discussing the variety of T-shirts worn (or other clothing items) by class members. List the different ways that T-shirts can vary, for example, colour, size, logo (or not), neck style. These features are variables in the design of a t-shirt because they can change.
- Ask the students to work in pairs to make up a T-shirt problem using 3 of the variables listed. For example, Aroha designs t-shirts in four colours, white, black, red and green. She produces three sizes S, M, and L. Her t-shirts can have either a V neck or a crew neck.
How many different designs can Aroha make? (4 x 3 x 2 = 24)
If you reach into Aroha’s blindfold bin what are the chances that you get a large, white t-shirt? (2/24 or 1/12) - Tell them to write the problem on one side of a piece of paper (or on the outside cover of a folded piece) and the solution on the other side.
- Then get them to trade problems with other students. When they have solved the problem compare their solution with that of the problem writers.
- Leave the problems on display on the maths board or make a book of outcomes problems.
- Students might enjoy exploring the creation and trialing of other spinners. Go to the Spinners learning object to try this out.
Dear parents and whānau
In maths we have been learning about probability. We have focused on the systematic counting of possible outcomes of simple events and have learnt how to use tree diagrams to count the number of outcomes. We have also learnt how to find the probabilities of different outcomes. Here are two problems you might like to try at home.
- Dice and a dollar: How many different outcomes are there when a dice is rolled and a dollar coin is tossed together? What is the probability of getting a head and an even number?
- Dice and Spinner: Make a cardboard spinner that is divided into three equal sections numbered 1, 2 and 3. Roll a dice and spin the spinner. Multiply together the number on the top of the dice and the number that the spinner rests on. How many different results are there? Is the probability of getting an even number the same as that of getting an odd number? What event has probability 5/18?
Enjoy investigating these probability activities with your child.
Solutions to Home Link problems
Problem 1: There are 6 outcomes for the dice and 2 for the coin so there are 6 x 2 = 12 altogether.
There are 1 x 3 = 3 ways of getting a head and an even number. So the probability of this is 3/12 = 1/4.
Problem 2: There are 18 different outcomes here. Since 12 of these are even, the probability of getting an even number is 12/18 = 2/3. The probability of getting an odd number is 6/18 = 1/3.
The probability of getting a number less than 4 is 5/18. (There are other possibilities here too. For instance, getting a number in double figures.)