In this unit we experiment with cubes to make predictions about likelihood based on our observations. Students find out that with probabilistic situations there is no certain way to predict exactly what will happen.
- Make predictions based on data collected.
- Identify all possible outcomes of an event.
- Assign probabilities to simple events using fractions (1/2, 1/6 etc).
Probability is a measure of chance or likelihood of an event occurring. In this unit bags of cubes are used to provide the sample space, that is the set of all possible outcomes. The chance of selecting a cube of a particular colour obviously depends on what is in the bag. Suppose there are 5 red, 3 blue and 2 yellow cubes in the bag.
The probability of selecting a red cube equals 5 out of 10 which can be written as 5/10, or 1/2, or 0.5 or 50%. Note that there are five outcomes (ways to select one cube) that result in the selection of a red cube. The probability of getting a blue cube with one selection equals 3 out of 10 (30%) and the probability of selecting a yellow cube equals 2/10 or 1/5 or 20%.
Probabilities can be used to predict what event is most likely to occur. Selecting a red cube is more likely than selecting a blue cube, which is more likely than selecting a yellow cube. That order assumes the cube is selected randomly which means that each cube has an equal chance of being selected. The prediction of the colour of the cube, especially for small samples, cannot be certain. In fact, all three colours might occur if one cube is selected. If enough selections are made, with replacement each time, the distributions of colour will more closely reflect the probability fractions.
The learning opportunities in this unit can be differentiated by providing or removing support to students and by varying the task requirements. Ways to support students include:
- physically modelling the sample space. In this unit emptying the bag to reveal the cubes provides a clear picture of all the possible outcomes
- helping students to record their models of the sample space, particularly through representations such as picture graphs
- connecting results of experiments with models of all the outcomes (See Session Three)
- using physical models, such as towers of cubes, to represent the probabilities as fractions such as 5 out of 10.
Task can be varied in many ways including:
- easing the cognitive load by reducing the number of cubes, and number of colours, in a bag, and using simple fractions like halves and quarters
- collaboratively grouping students so they can support each other
- reducing the demands for reporting through templates, e.g. tally marks, pictographs, with less writing and more oral discussion.
The contexts for this unit can be adapted to suit the interests and cultural backgrounds of your students. Many students are interested in kaitiakitanga, guardianship of the environment, so using a context about endangered species may be motivating. Aotearoa has many species in danger of extinction, and scientists conduct regular, ongoing surveys to monitor population numbers. Some example could be Maui or Hector’s dolphin, takahe, Chatham Island robin. Cubes in a bag can be a metaphor for a wide range of sampling contexts, from predicting the outcomes of games, to the likelihood of the weather being fine for Sports Day.
Te reo Māori vocabulary terms such as tūponotanga (probability/chance), hautau (fraction), hautanga ā-ira (decimal fraction), ōwehenga (ratio) could be introduced in this unit and used throughout other mathematical learning. Te reo Māori numbers and colours can be interchanged for English throughout the unit.
- Cubes of different colours
- Paper bags (preferably opaque)
- Stickers, or small pieces of tape
- Calculators
- Copymaster 1
Session 1
Today we make predictions about the cubes that are hidden in a bag. We find out that even when we can’t peek in the bag we can still make a good prediction about what is in it. Think of cubes in the bag like all the people in New Zealand or fish in our seas. We cannot know exactly about all of them but we can use statistics to get an idea.
- Put four cubes in a paper bag (3 red and 1 blue) without students seeing. Provide a context such as red are eels and blue are mudfish.
Here is a bag with four cubes. The cubes are either red or blue and we’re going to try to find out how many of each colour there are selecting cubes one at a time. - Shake the bag and ask a student to select one cube to show the class. Record the colour on the board and get the student to put the cube back in the bag.
This is called sampling with replacement. Replacement means we put it back – like a fish.
(Note: Each time a student takes a cube it must be returned before the next student draws a cube. Otherwise, the probabilities will change.) - Ask another student to select a cube.
What colour have you got?
If it is the same colour as the one previously drawn ask:
Do you think that it is the same cube? Why or why not?
If it is a different colour ask:
Does that mean that half the cubes are red and half are blue?
The important idea is that students acknowledge that such conclusions are speculative. There is no certainty except that at least one red (same colour drawn), or at least one red and one blue (different colours drawn) are in the bag. - Ask a third student to draw a cube but this time get them to predict what the cube might be.
Why did you guess that? How certain are you? - Add the third cube colour to the data.
Has that changed your mind about what is in the bag? Why? Why not? - Ask a fourth student to draw a cube.
- Look at the result of the four draws.
Do you think that we have seen all the cubes?
Do we know what the colours of the four cubes are? Why or why not?
Would we find out more if we had more turns? - Let another four students select a cube one at a time with replacement. Add the colour to the data on the board. Before selecting each time, ask the student to predict the colour of the cube.
Record your best prediction about the colours of the four cubes in the bag. - Ask students to discuss their predictions with a buddy and to justify their thinking. Look for acknowledgement of certainty and uncertainty. For example, if all the draws were red, we cannot say for certain that there is no blue cube. If one or more of each colour have been drawn, we can be certain that there is at least one cube of each colour in the bag.
Before we look in the bag, discuss all the possible combinations for the colours of the four cubes.
Record these combinations on the board. Students might forget the four of one colour, zero of the other colour possible combinations.Possible combinations for 4 cubes Red Blue 0 4 1 3 2 2 3 1 4 0 - Ask the students to decide which combination they think is most likely.
- Look inside the bag and check the cubes. Discuss how reliable their prediction was.
How could we have improved the prediction before checking?
Students might suggest that more selections might have improved the reliability. Larger samples tend to be more representative than smaller samples - Put the cubes back in the bag and ask:
I am going to draw a cube. Which colour do you think it will be?Why?
Can we be sure that I will get that one? Why?
How could we record your chance of success?
If students choose red their chance of success is 3 out of 4 or 3/4.
If they choose blue their chance of success is 1 out of 4 or 1/4.
Though there is a greater chance that the cube drawn will be red, there is still a 1/4 chance that it might be blue.
Exploring
Over the next three days we work in pairs to make our own bags of cubes. We swap them with our friends to see if they can guess "What’s in the bag?"
Session 2
- Invite each pair of students to choose 10 cubes. There should be two colours available. Ask them to put 10 cubes in their bag using any combination of the two colours they want.
- Swap bags with another pair of students. Students can create a context for their bag. E.g. rugby balls and soccer balls, tui and fantail. Each pair must predict how many cubes there are of each colour in the bag by taking turns drawing cubes from the bag, one at a time with replacement. Remind them to put the cube back in the bag after each draw. Tell students that they have 5 minutes to make as many draws as they can. It is important that they record their results. The results can be recorded on a chart or digitally.
- Ask the students to make a prediction about the colours of the ten cubes in the bag. How will you use the data to make the best prediction you can?
- Gather the class and share predictions. Do the students:
- acknowledge that their predictions are uncertain?
- relate fractions to their predictions, e.g. 20 out of 30 trial cubes were red, that’s 2/3 so 6 or 7 of the ten cubes might be red?
- provide a range of what events might occur, e.g. 5-7 red and 3-5 blue?
Ask the students to 'think aloud' so other students can build on their understanding.
Session 3
- In this session students predict events from complete knowledge of the set of cubes. In doing so, they consider the likelihood of the colour of the cube selected next.
- Show the students a paper bag with 24 cubes in it of varying colours, e.g. 10 yellow, 8 blue, 3 red, 2 green, 1 white. Tip the contents of the bag onto the mat or tabletop. Ask some students to sort the cubes by colour. Ask the students to provide a context for this activity that they can relate to.
I want you to create a data display of the colours. You are free to use whatever display you want. What display might you use? (Students might suggest bar graphs, pie charts, frequency tables, pictographs, etc.)
You can make as many trips as you need up here to view the data but you must create your display back at your desk. Give your students adequate time to create their displays. Explain the rules of the game to your students.
I am putting all the cubes back into the paper bag. Nothing in the set of cubes has been changed.
With each turn, one person from the class will take out a cube, tell you what colour it is, show you the cube then put it aside. It will not be put back into the bag.
Before the cube is taken out you need to make a prediction about what colour it will be. Record your predictions like this:Round Prediction Correct/Incorrect Points 1 Green I -1 2 Yellow C 3 3 Red I -1 … - If your prediction is correct, write C and give yourself 3 points. If your prediction is incorrect give yourself minus 1 point.
There will be 24 rounds. At the end of the game the +5 and -1 scores will be combined. The player with the highest score wins. - Before the game starts, remind your students about the display they created.
How might your display be useful? - Play the full 24 rounds of the game. As the number of cubes in the bag reduces, the students’ chances of correctly predicting increases to the point that on the last draw they should be certain of the outcome. Students can play this game with a buddy to provide scaffolding if required.
Watch for the following behaviour from your students:- Do they keep track of the colours of remaining cubes, using their data display?
- Do their predictions match the likelihoods, as expected from the colour frequencies of the remaining cubes?
- Do they successfully cope with the plus and minus nature of getting their score?
- At the end of the game interview the winner or winners about the secret to their success. Focus on the way they tracked the number of cubes of each colour left in the bag and how they used the frequencies of colours to make predictions.
- Pose various scenarios of cubes remaining in the bag and invite students to make predictions about the next cube. For example:
In the bag are 6 yellow, 4 blue, and 2 red cubes. What coloured cube do you think will be drawn next? - Calculate the probabilities for each colour. For example, there are 12 cubes all together so the chance of yellow equals 6/12 or ½, 4/12 or 1/3 of the cubes are blue, and 2/12 or 1/6 of the cubes are red. Yellow has the greatest chance of being selected.
- Trial selecting the next cube in each scenario. Students should come to realise that a colour may have the best chance but still not be selected. A high probability does not guarantee certainty.
Session 4
In this session students explore the impact of ‘tag and release’ methods of sampling. Such methods are common to biological research in which animals need to be returned to their habitat. The lake in this session could be named as a local lake to relate to students' experiences.
- Pose the following problem:
Suppose you are a scientist. The fish in the lake are precious so you want to return each fish after you have tagged it. How can you get an accurate picture of:- The total number of fish in the lake?
- The fraction of all the fish that are each species (type of fish)?
Types of freshwater native fish.
- Invite the students to offer ideas. Question b is like the previous inquiries. Taking fish out of the lake one at a time, noting the species, and returning the fish will allow a reasonable prediction of species as more and more data are gathered.
What is the advantage of tagging the fish?
Students will know if a tagged fish is caught that it is already represented in the data. - Produce a bag of cubes (fish), e.g. 8 red, 6 yellow, 4 blue, 2 green.
I have a lake full of fish here. You are the scientist and I am your fish catching assistant. Our aim is to find out the fraction of each species and get an estimate of the total number of fish.
Take some time to think about how you will record the data. - Take ten fish from the bag, one at a time, tagging the cube with a sticker before returning it to the bag. Watch how students record the data. Discuss the methods they are choosing.
You might need to suggest using a tally chart and to indicate with an asterisk if the cube is tagged (caught before). - After the sample of ten cubes is complete, ask students to predict the fraction of each species and the total number of cubes in the bag. Note that the total number will be impossible to estimate if no tagged fish are caught. Check:
Do their fractions match the distribution of cube colours in the sample?
Do they acknowledge that the predictions are very uncertain, given the small sample size? - Carry out another sample of 20 cubes, tagging and replacing. At the end of the sample ask your students to predict the fractions and total number.
Is it better to think about each sample as separate or treat the combined results as one big sample?
Pay particular attention to the issue of the total number of cubes.
For example, suppose five of the 20 cubes selected in the last sample are tagged.
What can this tell us about the total number of cubes in the bag?
About one quarter of all the cubes in the bag are tagged.
How might we predict the total number of fish from that? - Draw a pie chart like this to support your students:
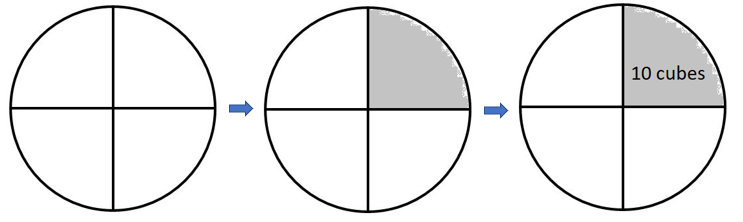
If the ten cubes we tagged at first make up one quarter of all the cubes in the bag, how many cubes might be in the bag?
Students might realise that four quarters make the whole population so 4 x 10 = 40 is the best prediction they can make.
How certain are you? What could we do to improve the reliability?
Students might say that tagging as many fish as possible would improve the reliability of the prediction. In fact, if we keep tagging fish we might reach a stage when every fish we catch is tagged.
Why is 'tag until every fish is tagged' not feasible in real life? (Population may be very large, the more animals that you tag the harder it is to find an animal that isn’t tagged.) - Check the actual contents of the bag. Students might realise that the estimate of total number of cubes (population) is much more reliable than the example above (It should be).
- Ask students to create a bag for someone else to sample. Limit the colours to a maximum of four but allow students to use any number of cubes between 20 and 50. Provide each student with marking materials like stickers, tape or blu tac.
- Students exchange bags and carry out an initial sample of ten cubes, tagging and replacing. They then take a sample of 20 cubes, tagging and replacing.
Tell them to record the data in an organised way and justify the predictions of fractions and total number.
How do they deal with fish that get selected but are already tagged? Do they tag them again? Does double or triple tagging improve the data? How? Monitor for any students who may need further support and provide as required. - Finish the lesson with a video about tag and release methods used by scientists. Many videos are available online.
Session 5
In this final session, pose the following problem to your students (Copymaster 1). Use their response to consolidate learning and to assess achievement of your students on the probability outcomes.
Look for the following:
Question One: Does the next sample of ten reflect the previous sample but also show variation from that sample? Students should show that the two samples will vary.
Question Two: Can students represent the part-whole relationships as fractions?
Question Three: Do students acknowledge that a green jelly bean could still be in the bag, but it has not been selected in the two samples? A sophisticated response will state something about the likelihood of a green being in the bag.
Question Four: Does the sample of five reflect proportions similar to those in the collected samples, with some variation?
After the students complete the task independently gather the class to discuss the ideas above. Students might reflect on how they might change their answers following the discussion.
Dear parents and whānau
This week in maths we have been making predictions about "What’s in the bag?" by drawing cubes from the bag (and then returning them). We found out that the more turns we had the more we knew about what was inside the bag. This knowledge helped us make predictions about what cube we might draw out next. However we also found out that with chance involved you can never know the outcome for sure. At home this week we want you to play "What's in the bag?" with your child.
What’s in the bag?
Put a total of six buttons (or counters) of two colours in a paper bag or container that you can’t see into. Your child might like to give the colours a context such as tennis balls and cricket balls, or kowhai flowers and mānuka flowers. Ask your child to try to work out what colours the six buttons are by drawing out the buttons one at a time. It is important that the button is put back into the bag each time. Let your child select one button as many times as they want until they are ready to predict the colours. Ask them to explain their prediction and then let them look in the bag.
Next time let your child make up a bag for you to work out.
Enjoy making your predictions and seeing if you are right!