The purpose of this unit is to to provide an opportunity for students to evaluate data and statistical interpretations, and chance situations, from research in the context of health and physical education.
- Evaluate statistical reports and data displays
- Calculate percentages
- Plan for reliable, valid statistical investigations
- Identify and evaluate trends and patterns in data, and use evidence from data displays (tables and graphs) to make evaluative statements
- Evaluate the validity of statements made by others about data
- Identify limitations in data displays
Students will evaluate data and statistical reports, drawing on their own interpersonal skills and processes that help them to make safe choices for themselves and others. The rich discussion that will arise over the statistics in this context can be used as a springboard or as scaffolding for further discussion in line with the health and physical education learning area.
To ensure maximum engagement and participation in this unit, you should consider your students' prior knowledge in the following areas:
- Planning and carrying out statistical investigations, and considering sample size, limitations, bias, validity of data, and appropriate question types.
- Constructing and analysing appropriate data displays for varied purposes.
- Using data analysis to make evaluative and concluding statements about what the data shows.
This cross-curricular, context-based unit aims to deliver mathematics learning, whilst encouraging differentiated, student-centred learning.
The learning opportunities in this unit can be further differentiated by providing or removing support to students, and by varying the task requirements. Ways to differentiate include:
- roaming and supporting students in a variety of groupings to ensure they understand the task at hand, the skills needed to succeed, and can apply these skills in a suitable process
- varying the amount of structured scaffolding and guided teaching you provide to students when investigating new tasks
- providing opportunities for students to create their own problems, ideally related to a familiar, relevant context (e.g. health issues that are related to your community)
- providing extended opportunities for students to revise and apply learning from throughout the unit
- modelling the application of ideas at every stage of the unit
- strategically organising students into pairs and small groups in order to encourage peer learning, scaffolding, and extension
- allowing the use of calculators to reduce the cognitive load required in each task
- working alongside individual students (or groups of students) who require further support with specific areas of knowledge or activities (e.g. identifying trends and patterns in graphs).
With student interest engaged, mathematical challenges often seem more approachable than when presented in isolation. Therefore, you might find it appropriate to adapt the contexts presented in this unit. For example, you might find a more recent, and relevant report from Sports NZ (or a similar organisation) that presents data around an issue that is meaningful to your students. Furthermore, you should consider the appropriateness of the data given for your students (i.e. around BMI, eating habits, exposure to cigarettes, alcohol and marijuana, and risky driving behaviours).
Structure
The first session is an introductory activity that is aimed to spark the imagination of students, to introduce the need for a particular idea or technique in mathematics that would enable them to explore deeper into that context. It is expected that rich discussion may be had around the context and around the nature of the mathematics involved.
Following the introductory session, each subsequent session in the unit is composed of four sections: Introducing Ideas, Building Ideas, Reinforcing Ideas, and Extending Ideas.
Introducing Ideas: It is recommended that you allow approximately 10 minutes for students to work on these problems, either as a whole class, in groups, pairs, or as individuals. Following this, gather the students together to review the problem and to discuss ideas, issues and mathematical techniques that they noticed during the process. It may be helpful to summarise key outcomes of the discussion at this point.
Building Ideas, Reinforcing Ideas, and Extending Ideas: Exploration of these stages can be differentiated on the basis of individual learning needs, as demonstrated in the previous stage of each session. Some students may have managed the focus activity easily and be ready to attempt the reinforcing ideas or even the extending ideas activity straight away. These could be attempted individually or in groups or pairs, depending on students’ readiness for the activity concerned. The students remaining with the teacher could begin to work through the building ideas activity together, peeling off to complete this activity and/or to attempt the reinforcing ideas activity when they feel they have ‘got it’. Note that the introduction of data around some of the given topics (e.g. marijuana) is likely to require structured, teacher-led discussion.
It is expected that once all the students have peeled off into independent or group work of the appropriate selection of building, reinforcing and extending activities, the teacher is freed up to check back with the ‘early peelers’ and to circulate as needed.
Importantly, students should have multiple opportunities to, throughout and at the conclusion of each session, compare, check, and discuss their ideas with peers and the teacher, and to reflect upon their ideas and developed understandings. These reflections can be demonstrated using a variety of means (e.g. written, digital note, survey, sticky notes, diagrams, marked work, videoed demonstration) and can be used to inform your planning for subsequent sessions.
The relevance of this learning can also be enhanced with the inclusion of key vocabulary from your students' home languages. For example, te reo Māori kupu such as tirohanga tauanga (statistical survey), whakaari raraunga (data display), ōrau (percent), tauira (pattern), tūtohi (chart, table of data), and kauwhata pou (bar graph) might be introduced in this unit and then used throughout other mathematical learning.
- Copies of the data displays, posters, and statements used throughout the unit. These could be displayed and shared digitally with students.
Introductory Session
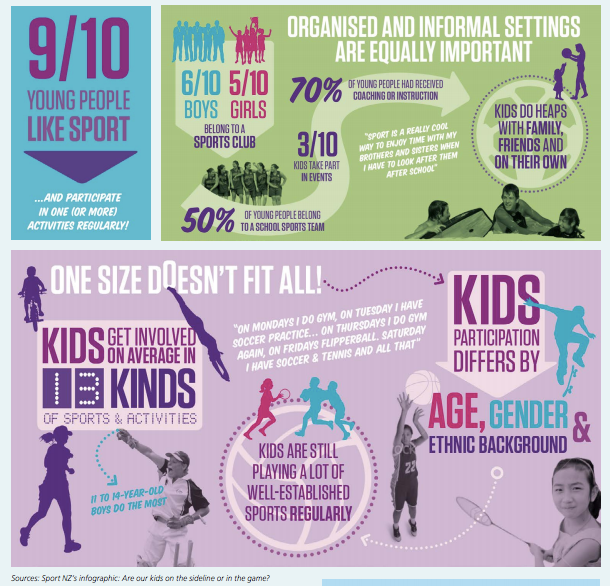
- Explain: Sport NZ surveyed school students in New Zealand and produced the following infographic.
Source: https://sportnz.org.nz/media/2107/rsss-section-one.pdf
- Discuss, using the the following prompts:
- What questions might SportNZ have posed to form these conclusions?
- Which statements are reporting calculated statistics and which are not?
Note how your students respond, and use these observations to determine your students' location on the interpreting statistical and chance situations learning progression.
The activity itself has a health and physical education focus, with mathematical skill and knowledge needed to evaluate statistical reports. Mathematical discussion around this activity can assist in the delivery of the health and physical education learning area achievement objectives:
- 5.A3 Investigate and practise safety procedures and strategies to manage risk situations.
- 5.C3 Demonstrate a range of interpersonal skills and processes that help them to make safe choices for themselves and other people in a variety of settings.
Session Two
This session focuses on statistical reports describing the sports participation of New Zealand school students.
Introducing Ideas
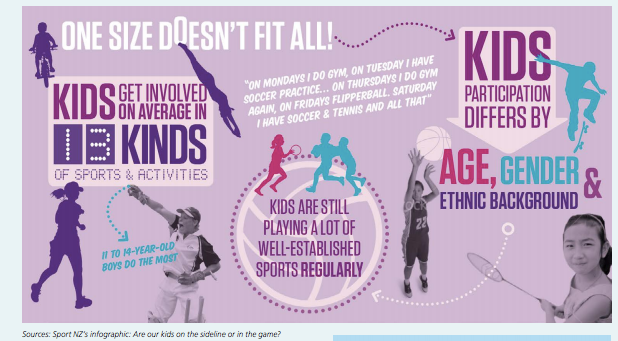
- Show students the bottom portion ("one size doesn't fit all") of the previously introduced infographic.
Source: https://sportnz.org.nz/media/2107/rsss-section-one.pdf
- Discuss.
The infographic states “11-14 year old boys do the most”.
- What is being implied in by ‘the most’? Is it the most time, the most number of sports, the most training…?
- Therefore, is this a clear statement of statistics or could it be misleading?
- What data could have been collected to substantiate such claims? What questions could have been asked in the survey?
- Are there any statements in the survey that are unambiguous and can be supported with statistics?
Building Ideas
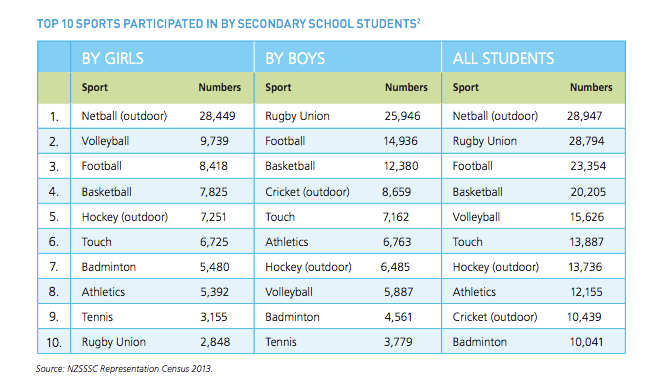
- Discuss the frequently-made claim that rugby is more popular than football. Encourage students to use the table below, which shows the most popular secondary school sports by gender, to support their conclusions.
- Is rugby more popular than football for boys and girls?
- What trends can you identify in these data? (consider indoor vs outdoor, team sports vs individual)/
- Provide time for students to come up with a few statements comparing the popularity of different sports, using the data from the table below.
Reinforcing Ideas
Source: https://sportnz.org.nz/media/2107/rsss-section-one.pdf
Extending Ideas
- Discuss:
- What are the limitations to the conclusions you have drawn from the data in the table?
- What more do you need to know about the survey to make substantiated conclusions from the data?
Session Three
This session focuses on comparisons made from New Zealand school students' sporting activity levels data.
Introducing Ideas
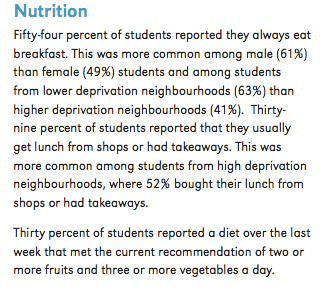
- Explain to students: The results of a survey on the health and wellbeing of secondary school students in New Zealand, carried out in 2012, included this comment on nutrition:
Source: https://www.fmhs.auckland.ac.nz/assets/fmhs/faculty/ahrg/docs/2012-overview.pdf
- Interpersonal skills are often defined as the ability for an individual to make safe choices for themselves and others.
- What are the safe nutritional choices suggested by this report?
- Discuss, drawing attention to the following ideas:
- What pattern of eating exemplifies a ‘safe choice’; had breakfast or not, brought or bought lunch, dieting or not dieting, consumed sufficient fruit and vegetables?
- In each case, what proportions of secondary school students in New Zealand exemplify safe nutritional choices?
Building Ideas
- Explain to students: The same 2012 survey found that 50% of students in high-deprivation areas were overweight/obese, and 29% of students in low-deprivation areas were overweight/obese.
- What does this suggest about the relationship between weight and wealth?
Reinforcing Ideas
- Explain to students: The survey on health and wellbeing of NZ secondary school students targeted 10 000 students. The physical health of the students was recorded. This include their BMI (body mass index).
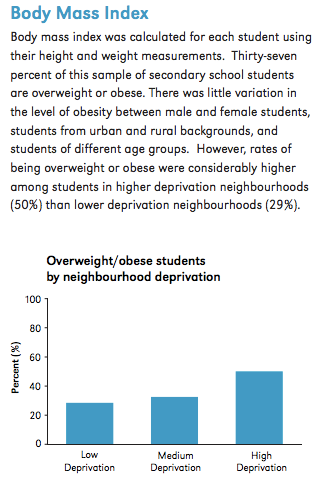
Source: https://www.fmhs.auckland.ac.nz/assets/fmhs/faculty/ahrg/docs/2012-overview.pdf
- What links, if any, are shown in the analysis of the BMI and neighbourhood deprivation data?
- Was the sample size sufficient to draw such conclusions?
Extending Ideas
- Provide time for students to do the following:
- Comment on the validity of the conclusions drawn in the discussion around BMI and the neighbourhood deprivation data.
- Consider: Is there evidence of a causal relationship?
- Consider: Could there be other contributing factors?
- Were the measures of obesity (BMI) and neighbourhood deprivation reliable for this purpose?
Session Four
This session focuses on substances; alcohol and smoking and marijuana.
Introducing Ideas
- Explain: The graph below shows responses to the “Youth2000” survey that questioned NZ secondary students in 2001, 2007 and 2012.
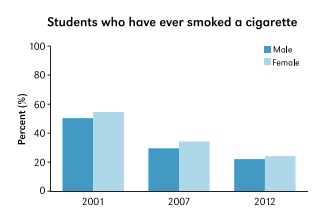
Source: https://www.fmhs.auckland.ac.nz/assets/fmhs/faculty/ahrg/docs/2012-overview.pdf
- Discuss: Which of the following statements are valid conclusions, about NZ secondary school students, that may be drawn from the data?
- More girls than boys have tried smoking.
- Girls are more likely to be addicted to smoking.
- Students don’t smoke as much now because it is more expensive.
- The number of students who have tried smoking has reduced since 2001.
- Discuss: A valid conclusion states only what can be deduced from the data.
- Which of the statements are saying more than in shown in the data?
- Why might those statements not be true?
Reinforcing Ideas
- Show and discuss the three graphs below, from the “Youth2000” survey. Have students make at least three valid statements that describe the trends shown in the data.
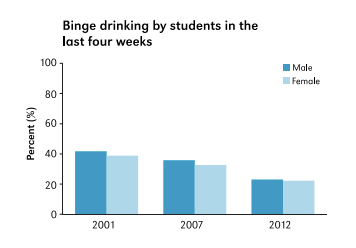
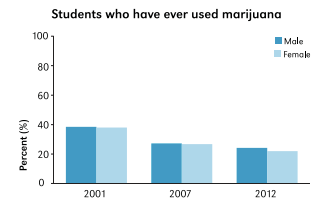
Source: https://www.fmhs.auckland.ac.nz/assets/fmhs/faculty/ahrg/docs/2012-overview.pdf
Extending Ideas
- Have students consider the graphs given, from the “Youth2000” survey, and consider the following questions.
- What does the data tell you about trends in the use of cigarettes, alcohol, and marijuana by New Zealand secondary school students?
- Is there a significant difference between the behaviour of boys than of girls, shown in these results?
- Could these results be used to find the number of students who may have tried cigarettes, marijuana and binge drinking within four weeks of the survey?
Session Five
This session focuses on risk taking behaviours. Examples are given around driving.
- Present students with the following graph from the “Youth2000” survey. Discuss it, and use the data given to write an attention grabbing headline for a local newspaper/news outlet.
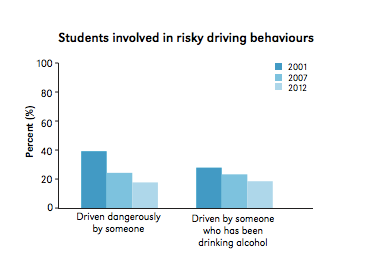
Source: https://www.fmhs.auckland.ac.nz/assets/fmhs/faculty/ahrg/docs/2012-overview.pdf
- Discuss, using the following prompts:
- What are possible factors that could have contributed to this trend?
- In the report that included this graph, students were quoted as crediting media campaigns with a greater awareness of road safety. To what extent do you think such use of media may have contributed to the trends shown in the graph?
Building Ideas
Use the graph “Students involved in risky driving behaviours” to find:
- The percentage of students who have been driven by someone who has been drinking alcohol in the 2001 survey.
- The percentage of students who have been driven by someone who has been drinking alcohol in the 2012 survey.
- Describe the trend of students who have been driven by someone who has been drinking alcohol, over time.
- Use your answer above (3) to predict the shape of the graph if a survey for this year was included.
Reinforcing Ideas
The concluding statements from the “Youth2000” survey included:
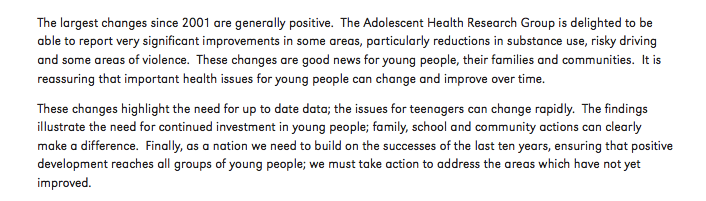
Source: https://www.fmhs.auckland.ac.nz/assets/fmhs/faculty/ahrg/docs/2012-overview.pdf
- Discuss:
- Highlight the part(s) that relate to risky driving behaviours.
- Identify the trends shown in the two graphs. Describe them as increasing or decreasing, and as linear or non-linear. Extend these statements to include a mathematical description of the trends shown in the graph of "Students involved in risky driving behaviours".
Extending Ideas
- Consider what the concluding remarks from the “Youth2000” report say about risky driving behaviours. The information came from students responding to survey questions.
- Are the data and trends shown likely to represent the population?
- What other ways could the trends in youth risky driving behaviours be gathered?
- Find supporting evidence from organisations such Statistics NZ and NZTA to build a stronger statement of risky driving behaviours and NZ youth.
Session Six
This session focuses on statistics surrounding 'making safe choices'.
Introducing Ideas
- Consider the statistics about NZ secondary school students that we have been looking at in this unit:
- Participation in sports
- BMI and eating habits
- Exposure to cigarettes, alcohol and marijuana
- Risky driving behaviours
- As a class, come up with a practical method of collecting reliable data on these issues. Consider the following:
- Which would give more representative data: interviews or questionnaires?
- Should the class survey selected students or ask for voluntary contributions?
- Should the sample include all students from selected schools or selected students from all schools?
Building Ideas
- Consider the reliability of youth data, collected from questionnaires. If your school were to investigate a sensitive issue within the school, how could reliable data be obtained?
Reinforcing ideas
- Consider the statistics about NZ secondary school students that we have been looking at in this unit:
- Participation in sports
- BMI and eating habits
- Exposure to cigarettes, alcohol and marijuana
- Risky driving behaviours
- Why is such data useful to collect?
- The “Youth2000” project collected data in 2001, 2007 and 2012. Was this frequency sufficient to give a clear pattern?
Extending ideas
Considering the statistics about NZ secondary school students that we have been looking at in this unit (participation in sports, BMI and eating habits, risky driving behaviours, and exposure to cigarettes, alcohol and marijuana) can you say to what extent are these issues interrelated?
- Could a group of youths with a high risk profile have skewed the data?
- How could the report writers have found and/or presented this?
Dear parents and whānau,
Recently we have been evaluating data and statistical interpretations, and chance situations, from research in the context of health and physical education. This has involved looking at safe choices in contexts such as students' participation in sports, BMI and eating habits, exposure to cigarettes, alcohol and marijuana, and risky driving behaviours. Ask your child to share their learning with you.