Trend

The Ministry is migrating nzmaths content to Tāhurangi.           
Relevant and up-to-date teaching resources are being moved to Tāhūrangi (tahurangi.education.govt.nz). 
When all identified resources have been successfully moved, this website will close. We expect this to be in June 2024. 
e-ako maths, e-ako Pāngarau, and e-ako PLD 360 will continue to be available. 

For more information visit https://tahurangi.education.govt.nz/updates-to-nzmaths

A general tendency among variables in a data set; usually between pairs of variables.

For two numerical variables, as values of one variable increase the trend is any general tendency of the change in the values of the other variable. See Example 1 below.

For two category variables, both of which have a natural ordering of their categories, as transitions are made from the lowest to the highest category, the trend is any general tendency of the changes in the categories of the other variable. See Example 2 below.

For a category variable that has a natural ordering of its categories and a numerical variable, as transitions are made from the lowest to the highest category for the category variable the trend is any general tendency of the changes in the values of the numerical variable. See Example 3 below.

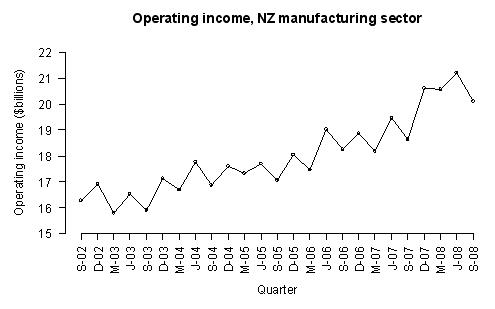
For time-series data the trend is any general tendency to change with time. See Example 4 below.

Example 1 (Two numerical variables)

Data were selected for 86 New Zealand school students from the CensusAtSchool website. The scatter plot below displays the data for their height and right foot length, both in centimetres.

As the length of the right foot increases there is a general tendency for height to increase. The trend is that, generally, an increase is right foot length is associated with an increase in height.

Example 2 (Two category variables, with a natural ordering of categories)

Data were selected for 86 New Zealand school students from the CensusAtSchool website. Two of the variables were their year level (5 or 6, 7 or 8, 9 or 10) and their usual level of lunchtime activity (Sit or stand, Walk, Run). The data are displayed in the two-way table and bar graph below. The table shows frequencies for each cell, as well as row proportions for each of the three groups of year levels.

As we move from year levels 5 or 6 to year levels 9 or 10 there is a general tendency for the proportion running during lunchtime to decrease and the proportion sitting or standing to increase. The trend is that for higher year levels, generally, there is an increase in less vigorous forms of lunchtime activity.

Example 3 (One numerical variable and one category variable with a natural ordering of categories)

Data were selected for 86 New Zealand school students from the CensusAtSchool website. The dot plot below displays the data for their heights, in centimetres, for three groups of year levels.

As we move from year levels 5 or 6 to year levels 9 or 10 there is a general tendency for height to increase. The trend is for students at higher year levels to be taller, in general.

Example 4 (Time-series data)

Statistics New Zealand’s Economic Survey of Manufacturing provided the following data on actual operating income for the manufacturing sector in New Zealand for each quarter from September 2002 to September 2008. Note that M, J, S and D indicate quarter years ending in March, June, September and December respectively.

Over time there is a general tendency for the operating income to increase. The trend is that as time goes by, generally, there is an increase in operating income.

Curriculum achievement objectives references
Statistical investigation: Levels 3, 4, 5, 6, (7), (8)