Relationship

The Ministry is migrating nzmaths content to Tāhurangi.           
Relevant and up-to-date teaching resources are being moved to Tāhūrangi (tahurangi.education.govt.nz). 
When all identified resources have been successfully moved, this website will close. We expect this to be in June 2024. 
e-ako maths, e-ako Pāngarau, and e-ako PLD 360 will continue to be available. 

For more information visit https://tahurangi.education.govt.nz/updates-to-nzmaths
A connection between two variables, usually two numerical variables. Such a connection may not be evident until the data are displayed. A relationship between two variables is said to exist if the connection evident in a data display is so strong that it could not be explained as only due to chance.

Example 1 (Two numerical variables)

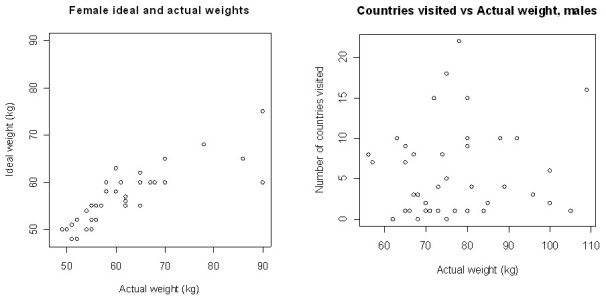
The actual weights and self-perceived ideal weights of a random sample of 40 female students enrolled in an introductory Statistics course at the University of Auckland are displayed on the scatter plot below (left). In general, as the values of actual weight increase the values of ideal weight increase. There is clearly a relationship between the variables actual weight and ideal weight.

The actual weights and number of countries visited (other than New Zealand) of a random sample of 40 male students enrolled in an introductory Statistics course at the University of Auckland are displayed on the scatter plot below (right). There is no clear connection between the variables actual weight and number of countries visited (other than New Zealand).

Example 2 (One numerical variable and one category variable)

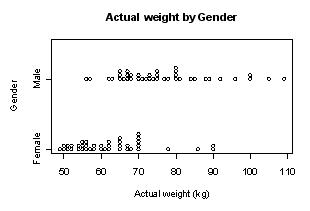
The actual weights of random samples of 40 male and 40 female students enrolled in an introductory Statistics course at the University of Auckland are displayed on the dot plot below (left). On average, the actual weight of males is greater than that of females. There is clearly a relationship between the variables actual weight and gender.

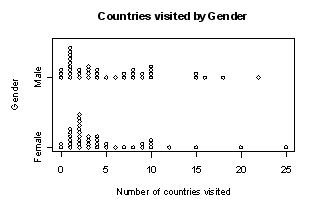
The number of countries visited (other than New Zealand) by random samples of 40 male and 40 female students enrolled in an introductory Statistics course at the University of Auckland are displayed on the dot plot below (right). The two sample distributions are quite similar indicating that there is no clear connection between the variables number of countries visited (other than New Zealand) and gender.

Example 3 (Two category variables)

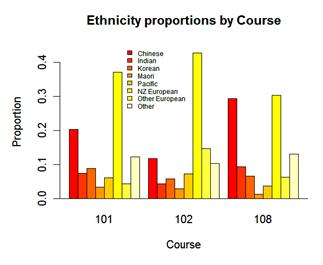
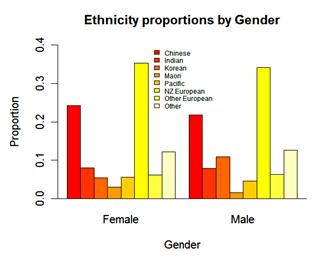
The two sets of bar graphs below display data collected from a random sample of students studying an introductory Statistics course at the University of Auckland. They are enrolled in one of 3 courses; STATS 101, STATS 102 or STATS 108.

The proportions of each ethnic group in each course are displayed on the bar graphs on the left. The three distributions are sufficiently different to indicate that there is a relationship between the variables ethnicity and course.

The proportions of each ethnic group for males and females are displayed on the bar graphs on the right. The two distributions are quite similar indicating that there is no clear connection between the variables ethnicity and gender.

See: association

Curriculum achievement objectives references
Statistical investigation: Levels 4, 5, 6, (7), (8)