Probability density function (for a continuous random variable)

The Ministry is migrating nzmaths content to Tāhurangi.           
Relevant and up-to-date teaching resources are being moved to Tāhūrangi (tahurangi.education.govt.nz). 
When all identified resources have been successfully moved, this website will close. We expect this to be in June 2024. 
e-ako maths, e-ako Pāngarau, and e-ako PLD 360 will continue to be available. 

For more information visit https://tahurangi.education.govt.nz/updates-to-nzmaths
A mathematical function that provides a model for the probability that a value of a continuous random variable lies within a particular interval. It is often useful to display this function as a graph, in which case this probability is the area between the graph of the function and the x-axis, bounded by the particular interval.

A probability density function has two further important properties:
1.    Values of a probability density function are never negative for any value of the random variable.
2.    The area under the graph of a probability density function is 1.

The use of ‘density’ in this term relates to the height of the graph. The height of the probability density function represents how closely the values of the random variable are packed at places on the x-axis. At places on the x-axis where the values are closely packed (dense) the height is greater than at places where the values are not closely packed (sparse).

More formally, probability density represents the probability per unit interval on the x-axis.
 
Example

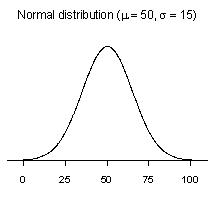
Let X be a random variable with a normal distribution with a mean of 50 and a standard deviation of 15. The graph below shows the probability density function of X.

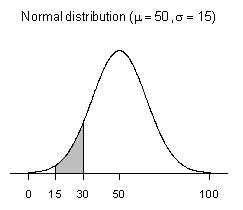
On the diagram below the shaded area equals the probability that X is between 15 and 30, i.e.,
P(15 < X < 30).

Curriculum achievement objectives references
Probability: Levels (7), (8)