Standard deviation

The Ministry is migrating nzmaths content to Tāhurangi.           
Relevant and up-to-date teaching resources are being moved to Tāhūrangi (tahurangi.education.govt.nz). 
When all identified resources have been successfully moved, this website will close. We expect this to be in June 2024. 
e-ako maths, e-ako Pāngarau, and e-ako PLD 360 will continue to be available. 

For more information visit https://tahurangi.education.govt.nz/updates-to-nzmaths
A measure of spread for a distribution of a numerical variable that determines the degree to which the values differ from the mean. If many values are close to the mean then the standard deviation is small and if many values are far from the mean then the standard deviation is large.

It is calculated by taking the square root of the average of the squares of the deviations of the values from their mean.

It is recommended that a calculator or software is used to calculate the standard deviation.

The standard deviation can be influenced by unusually large or unusually small values. It is recommended that a graph of the distribution is used to check the appropriateness of the standard deviation as a measure of spread and to emphasise its meaning as a feature of the distribution.

The square of the standard deviation is equal to the variance.

Note that calculators have two keys for the two different ways the standard deviation can be calculated. One way divides the sum of the squared deviations by the number of values before taking the square root. The other way divides the sum of the squared deviations by one less than the number of values before taking the square root. At school level, it does not really matter which key is used because for all but quite small data sets the two values for the standard deviation will be similar. Software tends to use the calculation that divides by one less than the number of values; but some offer both ways. The first way (dividing by the number of values) is better when there are values for all members of a population and the second way is better when the values are from a sample.

Example

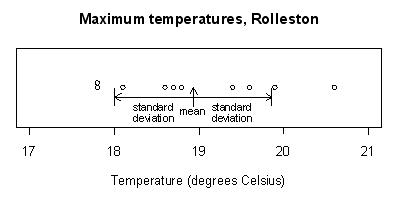
The maximum temperatures, in degrees Celsius (°C), in Rolleston for the first 10 days in November 2008 were: 18.6, 19.9, 20.6, 19.4, 17.8, 18.1, 17.8, 18.7, 19.6, 18.8

The standard deviation using division by 9 (one less than the number of values) is 0.93°C.

The standard deviation using division by 10 (the number of values) is 0.88°C.

The data, the mean and the standard deviation are displayed on the dot plot below.

See: measure of spread, population standard deviation, sample standard deviation, variance

Curriculum achievement objectives references
Statistical investigation: Levels (5), (6), (7), (8)