Mode

Thanks for visiting NZMaths.
We are preparing to close this site and currently expect this to be in June 2024
but we are reviewing this timing due to the large volume of content to move and
improvements needed to make it easier to find different types of content on
Tāhūrangi. We will update this message again shortly.

For more information visit https://tahurangi.education.govt.nz/updates-to-nzmaths
A value in a distribution of a numerical variable that occurs more frequently than other values.

As a measure of centre the mode is less useful than the mean or median because some distributions have more than one mode and other distributions, where no values are repeated, have no mode.

It is recommended that a graph of the distribution is used to check the appropriateness of the mode as a measure of centre and to emphasise its meaning as a feature of the distribution.


Example

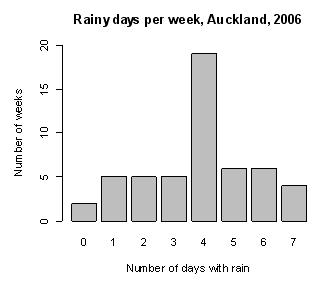
The number of days in a week that rain fell in Grey Lynn, Auckland, from Monday 2 January 2006 to Sunday 31 December 2006 is recorded in the frequency table and displayed on the bar graph below.

Number of days with rain Number of weeks
0

1

2

3

4

5

6

7
2

5

5

5

19

6

6

4
Total 52

The mode is 4 days with rain per week.

Curriculum achievement objectives references

Statistical investigation: Levels (5), (6), (7), (8)