This is a level (2+ to 3+) mathematics in science contexts activity from the Figure It Out series.
A PDF of the student activity is included.

Click on the image to enlarge it. Click again to close. Download PDF (1197 KB)
Students will:
- measure mass, height, and distance and find the average of multiple trials
- record data in tables and interpret the results with the help of representations
- identify the relationship between mass or height and the distance travelled.
Students should discover that:
- distance rolled is a function of mass x speed with which the car comes off the ramp
- variables can be independent, dependent, or controlled
- taking the average (mean) helps to identify the central tendency of a trend. In other words, average is a useful measure of centre.
small weights to place on or in the car
a measuring tape or ruler
a computer spreadsheet/graphing program (optional)
identical blocks of wood or books
a toy car
recording tables (see copymaster)
classmates
FIO, Forces, Levels 2+-3+, Zoom, Zoom!, pages 19 - 21
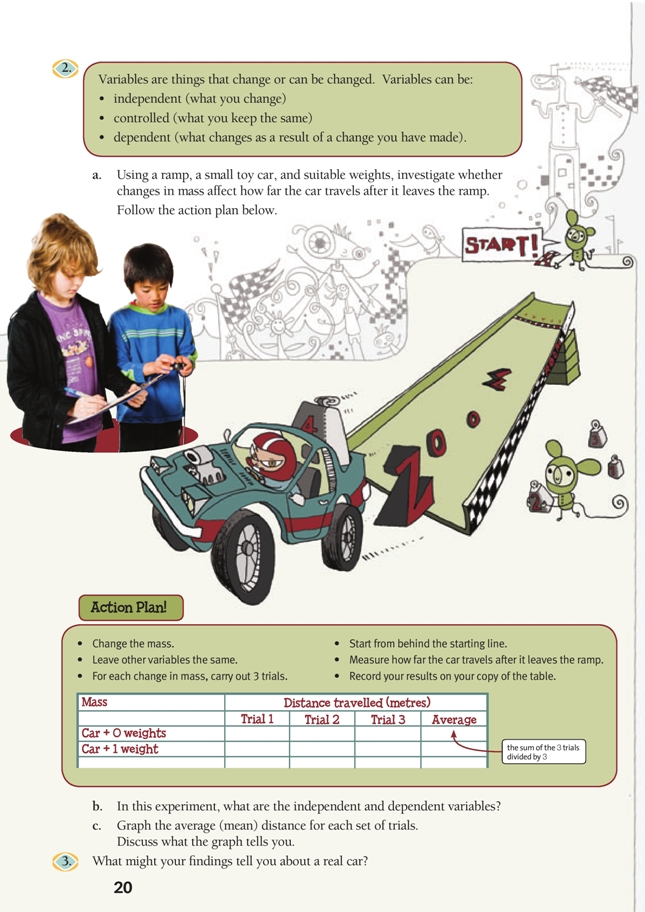
Activity One
Preparation and points to note
Make sure the students have enough uninterrupted space for the model cars to roll long distances without interruption. A smooth surface works best; carpets create friction*.
The students could do the graphing on a computer spreadsheet programme.
In this activity, students need to make sense of information, draw on their own experiences, and debate their ideas, all of which use and further develop the key competency thinking.
The students will have prior knowledge, ideas, and misconceptions about mass, height, and distance. Encourage them to test and argue their ideas and to fi nd evidence or counter-arguments via their investigations. Students need to be explicitly taught the norms of mathematical argumentation and that it’s the ideas that are competing and being evaluated, not them.
Although the students may know by now that weight doesn’t affect speed (see Flying High, pages 4–6), they may not realise that mass does affect momentum. Weight affects speed down the ramp (the pull of gravity), but it’s the mass (and friction) that affects speed after a car leaves the ramp. Heavier cars have more momentum, so they travel further, given the same amount of friction. Note that in the Swing Time activity, the pendulum speed was also not affected by weight, but heavier pendulums have more momentum and continue to swing for a longer time.
Points of entry: Mathematics
All the aspects that the students suggest will be variables. Prompt them to consider other variables and classify them as independent or dependent.
Make sure that everyone understands the defi nitions of independent, dependent, and controlled variables.
Measurement should be discussed in conjunction with accuracy, units, and error. Instead of grams or kilograms, the students can use informal units for mass, for example, identical small weights. Make sure they understand why the units must be uniform.
Discuss why averages (means) are useful when analysing data. It is unwise to rely on the results of just one measurement because of conditions and human error. Discuss averages in relation to activities that are naturally prone to variation, for example, traffic, air temperature, attendance, or driving speed, where any one measurement will not give you a good picture of overall conditions.
Ask the students to think about why they are asked to graph their results and about what type of graph to use. What advantages does a graph have over a table? Why do we use different representations?
Points of entry: Science
Remind the students what it means to “think like a scientist”. This activity reintroduces the scientifi c inquiry method (see page 5). Ensure that the students are comfortable with the cycle of hypothesis, design of experiments, data gathering, and conclusion.
Ask: What factors will affect distance? How can we test their effect fairly? Have the students invent experiments, for example, ask How could you test whether wheel size affects how far a car travels? For each test, prompt the students to determine the independent and controlled variables. (The dependent variable for these tests should always be the distance travelled.)
Challenge the students to justify why they think a particular variable may be important. This will reveal much about their science understandings. For example, air resistance increases with speed, but the cars will probably not go fast enough to make air resistance important. Variables that could spark students’ thinking include starting location, wheel size, axle size, lubrication, wheel shape, wheelbase, and the car’s length, width, and centre of gravity.
Prompt your students to identify what makes their investigation “scientific”.
Relate their results back to their initial predictions: So did mass have an effect? Cognitive science tells us that people learn better when they think about how they learn. Ask How did the structure of the investigation help you make conclusions? Ask the students to think critically about how they pursued their investigation and what changes would have improved it.
Answers
Activity One
1. Ideas will vary. (Try to explain why you think your ideas will make a difference.)
2. a. Practical activity
b. The dependent variable is the distance travelled. The independent variable is the thing changed in each trial (in this case, mass).
c. Graphs will vary. However, each graph should show that heavier cars go further after they leave the ramp. A possible graph is:
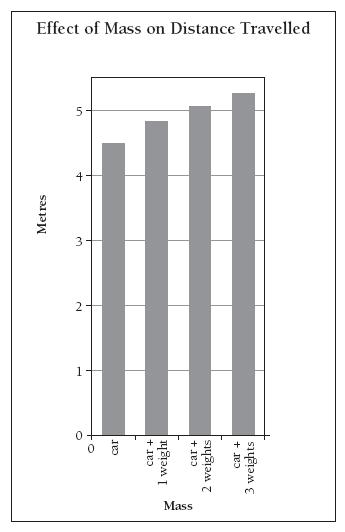
3. In real life, a heavy car will be harder to slow down or stop than a lighter car travelling at the same speed (because the heavier car has more mass).
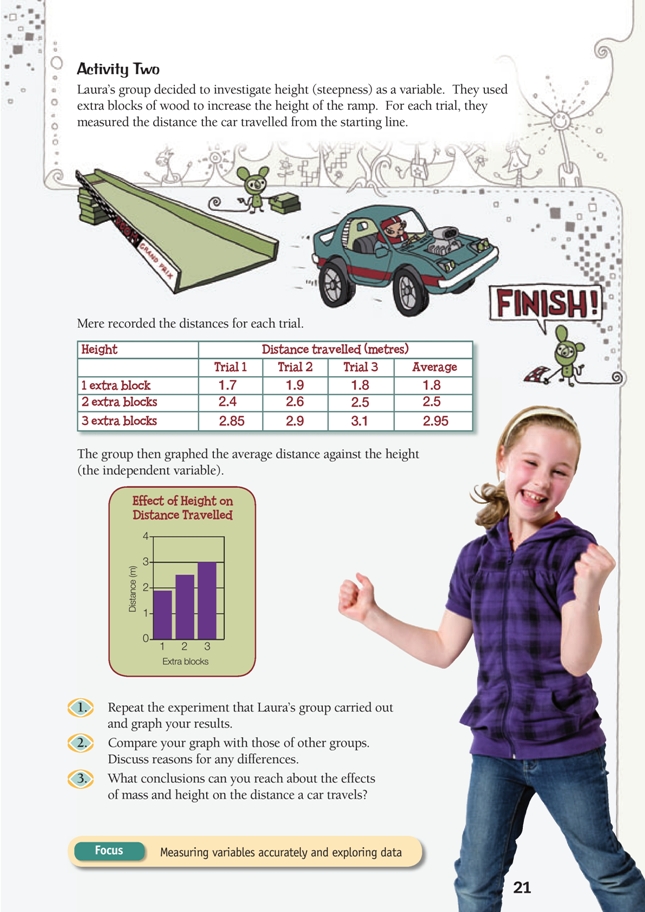
Activity Two
Preparation and points to note
Changing the height will change the angle at which the ramp meets the ground. Cardboard and tape will help round any sharp angles or sudden drops. Make sure that the students have a way to secure the top of the ramp at different heights, for example, by propping the ramp up with different numbers of the same blocks (or books).
Ask the students to think about factors such as why it’s important to start the car at the same spot for every trial and where the location of zero is on their horizontal scale of distance.
This is a natural opportunity to mix up groups so that the students work with a diversity of classmates. By being actively involved in a group with a common interest and focus, they are developing skills that apply to the key competency participating and contributing.
Points of entry: Mathematics
Link back to the ideas of independent, dependent, and controlled variables. On graphs, the mathematical convention is for the independent variable to go along the horizontal axis.
Ask: What other variables are contributing to the results? How do different cars behave on a ramp that is kept at the same height? Remind students to think about sources of error.
Points of entry: Science
The activity calls for multiple trials at different heights in order to get more data points (and hopefully, better accuracy).
Have the students relate their results back to their initial predictions: Did height have an effect?
Guide the students to think about weight and height together. The combination of the heaviest car on the highest ramp should clearly go the furthest. Have the students compare intermediate cases, for example, a light car on the highest ramp versus a heavy car on the lowest ramp.
As noted for Activity One, encourage the students to realise that the force of gravity pulling on a car is its weight (going down the ramp), but once the car is off the ramp, it is its mass that determines how far it will roll.
Answers
Activity Two
1. Practical activity. Your graph should show that the higher ramps caused the car to travel further.
For example, if you used up to 4 extra 10 cm blocks, your graph should show a similar pattern to this:
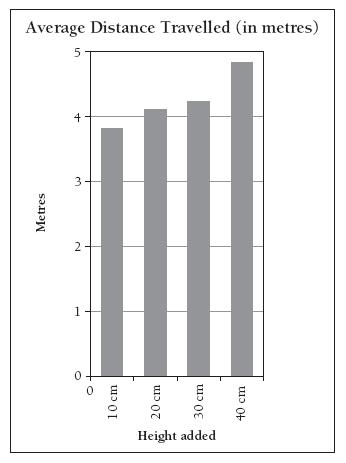
2. Different groups should have similar shaped graphs. However, the actual values will depend on factors such as the length of ramp, car, friction, and extra blocks used.
3. A heavy car on a high ramp should go furthest.