This unit is designed to engage your class for at least the first week of the school year. It provides you, their teacher, with opportunities for you to learn about their current level of achievement.
- Use multiplication to solve rate problems, especially about units of time.
- Use and calculate with metric units for mass and standard units of time.
- Use scales to estimate distances and times.
Rates and ratios both involve the comparison of two numbers. A rate is a comparison of two numbers with different units, whereas a ratio compares two numbers with the same unit.
There are many examples of rates in our everyday lives: speed (kilometres per hour), remunerative pay (dollars paid per hour of work), pulse (heartbeats per minute), or price (cost per unit bought).
The simplest rates are called unit rates and are expressed using one unit of the first measure for every ‘so many’ units of the other measure. For example, one breath every 6 seconds is a unit rate. When working with unit rates we multiply or divide both measures by the same amount to ensure the rate is constant. For example, to find out how long it will be before four breaths elapse multiply both measures by four, 4 x 6 = 24 seconds.
Much of the mathematics in this unit involves the use of rates, particularly rates over time.
The learning opportunities in this unit can be differentiated by varying the scaffolding provided or altering the difficulty of the tasks to make the learning opportunities accessible to a range of learners. Ways to supports students include:
- using collaborative grouping (mahi tahi) so students can support each other and experience both tuakana and teina roles
- working directly with students who need support when working with rates, exploring approaches which involve repeated addition
- changing the numbers used in the problems so that students are working with whole numbers that they can confidently operate on
- encouraging sharing and discussion of students’ thinking.
This unit draws on facts about the students and their preferences and experiences. It includes investigating the number of times students blink in a year, how much sleep they get, the food they eat, and their favourite pastimes and travel locations. The activities can be adapted to ensure students’ experiences and interests are included. For example:
- including foods that you know are freely available within the community and use costs from local shops when calculating
- including activities that are currently popular with students when talking about favourite pastimes
- using locations that are familiar with students when talking about travel within New Zealand. Use a map of the local region and some local places of interest or significance rather than a national map, if this is more appropriate.
Te reo Māori vocabulary terms such as pāpātanga (rate), ōwehenga (ratio), whakarea (multiply, multiplication), and whakawehe (divide, division) could be introduced in this unit and used throughout other mathematical learning.
Prior Experience
Students will present a range of prior experience of working with numbers, geometric shape, measurement, and data. Students are expected to be able to apply place value to add and subtract two digit whole numbers. If they are not yet confident in these operations, you may spend some time, prior to starting this unit, reinforcing these skills.
Session 1
- Talk to your students about the purpose of the unit, which is to find out some information about them, so you can help them with their mathematics.
- Explain to students that in this unit we are going to work out some interesting facts about what will happen to us this year.
Here is an interesting fact. You will probably blink about ten times per minute.
- Discuss why humans blink. There are two main reasons; to keep our eyes moist and to protect them from light, dust and other potential damage. It is hard to gather data on blinking because people tend to alter their blinking patterns if they are being measured. You could gather data from your students about how often they blink, but it is not necessary for this lesson.
- Show Slide 1 of the PowerPoint, which shows Toby trying to work out how many times he blinks in one year. Invite ideas about how Toby can create a reliable estimate. Students might suggest that Toby will not blink when he is asleep. If he sleeps for nine hours, then 15 x 600 = 9 000 blinks are a good estimate for one day. Multiplying 9 000 by 365 (days in one year) gives an estimate of 3 285 000.
Move onto Slide 2 which shows Lena who is estimating how much she will grow in height this year. She thinks that portioning her height into ten equal parts gives an estimate of her height gain each year. Do your students recognise that her thinking is flawed for two main reasons?
- She was not zero centimetres tall when she was born.
- Growth rates vary at different ages, children grow very fast in their first two years and early adolescents also grow fast.
Lena is also unlikely to be an exact whole number of years old. For example, she might be 9 years, 7 months old.
- Slide 3 shows three strategies that Lena might use to estimate her gain in height this year. Discuss the strategies linking them back to the flaws in her original thinking.
The left-hand strategy is the division of her total height by her age in years. The middle strategy allows for her height at birth (50 cm) by subtracting that amount from her height at ten years. The right-hand strategy allows for her birth length and her growth spurt from zero to two years. 84cm is the average height for a two-year-old girl. The difference of 56 cm needs to be divided by 8 since that represents growth over eight years not ten. The right-hand method is the most accurate and 56 ÷ 8 = 7cm is a good estimate of yearly growth in height.
- Provide your students with their own copy of Copymaster 1. Ask them to make their own estimates first before collaborating with a partner to solve the problem. Allow access to calculators as the focus of this session is on conceptual thinking about multiplication rather than calculation strategies.
- Wander the room and look at how students approach the problems:
- Do they recognise situations when no change will occur during the year? (body temperature and number of teeth and bones)
- Do they apply the constant rate as the multiplier in multiplicative situations?
- Do they have a sense of the size of numbers, including decimals, and of the units of measure?
- After a suitable period bring the class together to discuss their answers. The most important issue is how to tell if a situation is multiplicative or not. A situation is multiplicative if a rate exists, that is, a constant change in one measure for every constant change in another measure. Heart beats are a good example, a pulse rate of 70 beats per minute is a rate. To estimate the number of heart beats per year this rate must be assumed to be constant, despite knowing that pulse rate increases with exercise and decreases with sleep.
Session 2
In this session students explore healthy living, consider their current habits, and compare those habits to experts’ recommendations. Links could be made to the health curriculum, and informative writing (e.g. writing a list of tips for staying healthy). Be sensitive to your students’ home lives and their perceptions of “good health”.
Ask students: What do you need to do this year to stay healthy and learn best?
Students are likely to have heard good health messages previously. They might suggest ideas like:
- Eat good food
- Exercise everyday
- Avoid too much television or computer time
- Get plenty of sleep
- Restrict the amount of sugar they consume.
You might discuss the ideas further.
What is good food?
How much exercise and sleep should they get?
What foods contain lots of sugar?
Sleep
- Gather some data about your students. Begin with sleep. Ask students to work out how many hours and minutes sleep they got on the previous night. A linear representation may help some students to make the calculation. Demonstrate how to work out the amount of sleep for different start and finish times. Here is a calculation for bedtime at 8:20pm and rising at 7:15am.
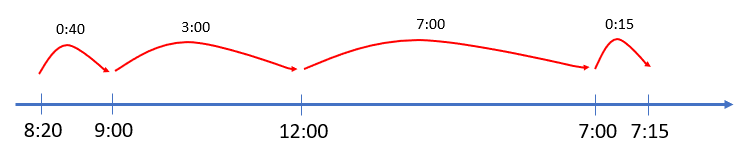
- The complication with adding hours and minutes is that measurement of time is based on sixty, not ten. If sixty minutes amass then an extra hour is created. In the case above this does not occur. Adding the minutes gives 40 + 15 = 55 and adding the hours gives 3 + 7 = 10. The total time is 10 hours 55 minutes.
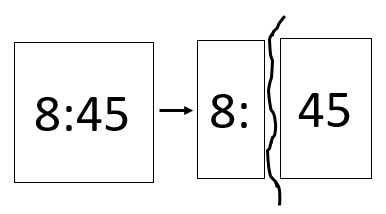
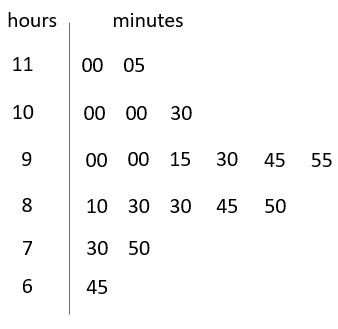
- After students have calculated their sleep time you might graph the data using a stem and leaf plot. Asking students to record their time on post-its makes creating the graph on a whiteboard or large sheet of paper easy. Cut each post-it into hour and minute parts.
- Look up the recommended hours of sleep for kiwi children online. For nine and ten-year-old children the usual amount is 9-11 hours per night.
What fraction of our class is getting enough sleep on weeknights?
- Ask students to work out the time they should go to sleep and wake up to meet the requirement of 9-11 hours per night.
- You might calculate how many hours of sleep each student in the class should get this year. Based on ten hours per night the calculation is:
365 x 10 = 3 650 hours per year 3 650 ÷ 24 = 152 days per year
Food
- Next consider what a balanced approach to healthy eating looks like. Guidelines can be found online at https://www.healthed.govt.nz/ which is New Zealand Government sponsored or it is easy to locate other resources. Search ‘Healthy eating for children 2-12 years’ and you will find recommended daily intakes. Copymaster 2 contains the recommended number of servings per day for each food group.
- Ask your students to record what food they ate yesterday and to match the items from each meal and snack to the food groups. Encourage them to estimate the quantities of each food they consumed and compare what they ate with the recommended portions.
- Then pose this problem:
Imagine you ate according to the foods and amounts on the copymaster. Work out how much of each type of food you will need to buy for a whole year.
- Let the students work in small groups to establish the amounts of each food they will need. Allow them to use calculators. Look to see:
- Do your students use multiplication correctly to establish the amounts?
- Do they show a sense of the size of metric measures? (For example, 1 kilogram equals 1000 grams)
- After an appropriate time, share some of the answers. Focus on a few food groups.
If you eat two pieces of fruit everyday how much do you consume in one year? 2 x 365 = 730 pieces of fruit.
How many kilograms is that?
- You may bring along some fruits and weigh them to work out how many of each fruit weigh 1 kilogram, or you might prefer to look up the average number of pieces in a kilogram online.
- You might also ask students to work out the daily or annual cost of some foods. For example, if 5 bananas weigh 1 kilogram and bananas cost $2.50 per kilogram, then 730 bananas weigh about 730 ÷ 5 = 146 kilograms and cost about 146 x 2.5 = $365. To eat two bananas costs $1.00 per day.
Consuming 100 grams of meat per day totals 365 x 100 = 36 500 grams per year. That is 36.5 kilograms. At a cost of at least $12.00 per kilogram that totals at least 36.5 x 12 = $438 per year per person. That’s expensive if you have a large family!
Screen Time and Exercise
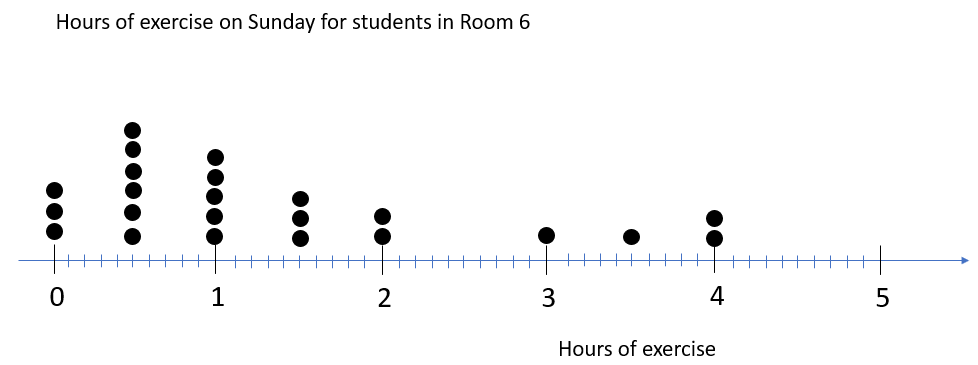
- Experts recommend that students spend no more than two hours per day on screen time (television, gaming and computers) and spend at least one hour on exercise. Gather data from your students about how much screen time and exercise per day they remember having during the previous weekend.
- Invite ways to display the data. You might use dot plots to show the frequencies for each amount of exercise.
Session 3
In this session students build on the work on amount of sleep and exercise to establish how much time they will spend on other activities. The last two sessions have mostly been about things we have to do.
- Tell students: We can’t control our heart or breathing much. In this lesson let’s explore things we like to do. Scheduling in experiences that make us feel good rewards us for doing the things that are more like work. What are some of the things you like to do?
- Invite ideas from students about their favourite pastimes. Sport and cultural pursuits like dancing are likely to be popular though many students will mention playing on digital devices. ‘Hanging out’ with friends is also likely to be popular, but ask students to explain what they do with their friends, e.g. talk, shop, view. Give each student two cards and ask them to write down their two favourite pastimes. Put all the cards in the middle of the floor and collectively sort the data. If all the cards are the same size, then a bar chart can be created as you sort.
- Next, ask your students to solve this problem:
- How much time will you spend this year doing your two favourite activities?
- What fraction of all the time you have this year are your favourite activities?
- Let students use calculators. Ask students to record their calculations and show clearly what the numbers they use relate to. Observe as your students work:
- Do they create an appropriate calculation to work out the time they spend on each activity?
For example, a student who learns a musical instrument might include 1 hour for a lesson and 3 hours practice each week. They might allow for not practising for a few weeks in the holidays. So, their calculation might be 48 x 4 = 192 hours in the year. - Do they correctly calculate the amount of time they have in the year using an appropriate unit and conversions between units?
Since activities usually take hours, using hours as the unit makes sense, but some students may choose minutes for more accuracy. Watch to see if students allow for time being based on sixty, not ten or 100. Some students might remove sleep time as that is not available for activity. - Do they record the amount of time as a fraction and are they open to the possibility of simplifying the fraction?
For example, 365 x 24 = 8760 hours available. Allowing for 9 hours of sleep per day the hours reduce to 365 x 15 = 5 475. This is a small fraction, 3.5%. Students might try to use percentages or decimals to get a sense of the proportion of time they spend on leisure activities.
- Do they create an appropriate calculation to work out the time they spend on each activity?
- After a suitable time, gather the class and share some findings. Students might notice that people dedicated to an activity, particularly elite sports or arts, spend a lot of time perfecting it. Some sports scientists believe 10 000 hours of practice are needed to hone skills to a professional level and the time may be double that for musicians. Students might also notice that the time spent on enjoyable activities is relatively small compared to other tasks.
- Ask the class: How can we work out the amount of time this year that we will spend on school subjects like reading, writing and mathematics?
- Model the calculations together using a calculator and being clear about what each number is representing. For example:
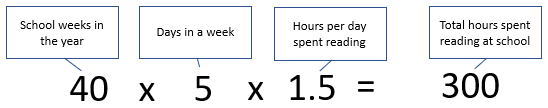
- Allow for variations that arise from the ideas of students, such as “We read at home as well,” or “Is researching online still reading?” Express the amounts of time as fractions and compare them to those found for enjoyable activities.
Session 4
In this session students consider where in New Zealand they might travel this year.
Sometimes New Zealanders do not appreciate their own country. In the mid-1980’s an advertising campaign was launched to encourage New Zealanders to visit their own country before going overseas. You can search for the video using “Don’t leave home until you've seen the country.” In a similar vein, the 2020 tourism campaign “Do something new, New Zealand” encouraged New Zealanders to explore new destinations in New Zealand and keep the tourism sector alive. This came about as a result of the stoppage of international tourism in New Zealand, which was due to the Covid-19 pandemic. In this task students find out how long it will take to drive from their location to given attractions.
- Provide students with a road map of the North or South Island of New Zealand without a scale, showing the main state highways and the tourist spots listed below. You may find it convenient to make these maps by printing images from Google maps onto A3 paper. Students will need to work in pairs and have access to string, a ruler and a calculator.
- Give students the following challenge:
- For North Island based students:
If you know that the distance from Hamilton to Auckland is 125 km and the driving time is about 1 hour 36 minutes, then work out the distance and driving time from your home to each of these tourist spots:
Paihia, Hot Water Beach, Raglan, Waihau Bay, Waitomo, Rotorua, Taupo, New Plymouth, Napier, Wellington.
For South Island based students: - If you know that the distance from Christchurch to Timaru is 165 km and the driving time is about 2 hours 12 minutes, then work out the distance and driving time from your home to each of these tourist spots:
Picton, Nelson, Kaikoura, Hanmer Springs, Franz Joseph Glacier, Lake Tekapo, Queenstown, Moeraki, Bluff.
- For North Island based students:
- Encourage students to cut a piece of string that is the same length as the reference distance (Hamilton to Auckland or Christchurch to Timaru), cut strings that are the same lengths as the distances from home to the tourist spots, then use the relationship between the two lengths to estimate the distances and drive times. For example, estimating the distance and drive time from Christchurch to Hanmer Springs:
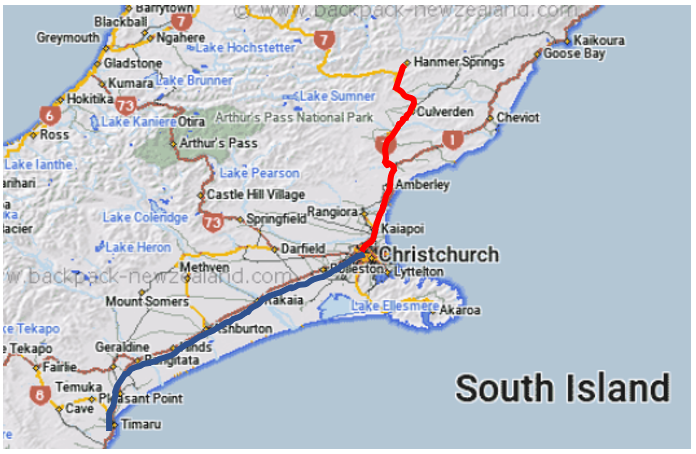
When the pieces are straightened and aligned they will look like this:
If the blue string represents 165km, what does the red string represent?
Students might use halving to find that the red string is a bit more than three quarters of the blue string. So, 3 x 41 = 123 km is a good estimate.
If the blue string represents 2 hours 12 minutes, what does the red string represent?
Students might use halving to find that the red string is a bit more than three quarters of the blue string. So, 3 x 30 = 90 minutes is a good estimate.
- Watch students as they work on the tasks.
Do they think proportionally about the distance or time they are estimating and the reference distance and time?
- Once students have estimated the distances and drive times, they should check their answers online.
- For the final part of the lesson ask students to find two different New Zealand destinations they would like to visit this year. For each destination ask them to calculate the distance and car travel time from their home town. Alternatively, students might like to calculate the distance and car travel time from their hometown to a place in Aotearoa where a friend or whānau member lives.
Session Five
In this session students use a bank of problems set at Level 3 of the mathematics curriculum to establish some learning goals for the year.
Copymaster 3 contains a set of problems for students to solve independently. Do not allow the students to use calculators so you get a window into their mental and written strategies. Encourage them to record as much information as they can about how they solved the problems. They should write on the copy as an achievement record. You might use this same set of problems at the end of the year to demonstrate growth.
After completing the problems, provide the students with the answers so they can check their attempts. Ask students to use the problems to identify areas of mathematics they think they are good at and those they need to improve at. They might record mathematics goals for the year in their exercise book.
Dear family and whānau,
For the first week of school our mathematics unit is about setting goals for this year. We will investigate how many times we will do things this year (like blink), how long things will take, healthy eating and sleeping, and the distance and travel time to our favourite places. We will also test ourselves on some maths problems to set learning goals for this year.