This is a level (3+ to 4+) mathematics in science contexts activity from the Figure It Out series.
A PDF of the student activity is included.
Click on the image to enlarge it. Click again to close. Download PDF (1226 KB)
Students will:
- accurately measure, record, and average data with 2 variables (water temperature is the dependent variable; wind is the independent variable)
- use a table to identify patterns and/or relationships and calculate the heat energy effect of wind.
Students should discover that:
- the rate of cooling is proportional to the wind (the greater the wind, the faster the water cools down).
a timer or watch
1 litre jug
hot water
a 3-speed fan
a plastic bowl
data tables (see copymaster)
access to the Internet or a library (for the investigation)
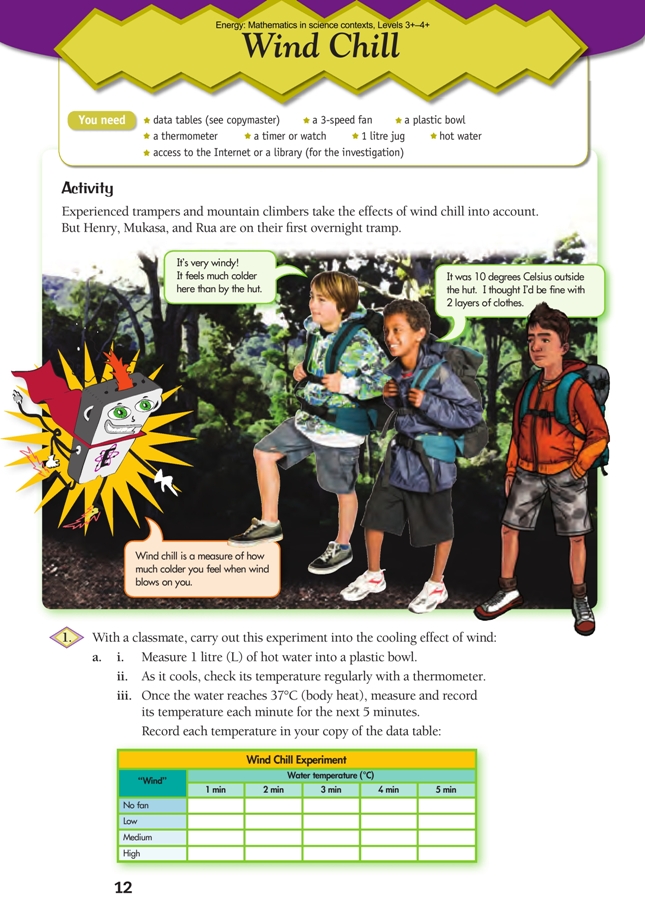
FIO, Energy, Levels 3+-4+, Wind Chill, pages 12 - 13
Preparation and points to note
If you don’t have a 3-speed fan, use multiple fans to increase the amount of wind for the experiment. Before the students start the experiment, relate it to their prior knowledge of wind chill*. Ask Which feels colder, a windy 20°C day or a calm 20°C day? Ask the students to blow on the back of their hand and then say what they feel. Then have them moisten the back of their other hand using a wet cloth and blow over the wet area. Ask Was there a difference between what you felt blowing over the dry hand compared with the wet hand? (The wet hand should feel cooler because the water evaporates from the surface of the skin and, in doing so, cools the body. This is the principle behind sweating. You may wish to point out that the wind on the dry hand had very little cooling effect because wind by itself doesn’t change the temperature.)
There are common misconceptions about wind chill, for example, that wind makes the air colder. Be careful to differentiate between feeling colder (losing heat faster) and being colder (lower body temperature). Wind chill is dangerous because the wind causes us to lose more heat energy, especially if we are wet and experiencing evaporative cooling. A simple way to demonstrate that wind does not affect air temperature is to take 2 readings with a thermometer: one in front of a fan and another out of its airstream.
Investigations should be structured so that the students can draw meaningful results. Prompt them to
apply the results of their investigation. (This can be linked to thinking in flexible ways, an aspect of the key competency thinking.)
Points of entry: Mathematics
This activity is a controlled experiment to measure the (rate of) energy loss associated with wind chill. Direct the students as little as possible; instead, encourage them to apply the various stages of the statistical enquiry cycle (problem, plan, data, analysis, conclusion) on their own. Prompt them to think about the variables involved (dependent, independent, and controlled). Encourage them to consider how they will standardise their investigation: How far are you going to put the fan away from the bowl? Will its distance make any difference? What else about the fan might make a difference? Why is it important to use the same amount of water in each trial? (Less water may have less surface area exposed to the wind and will therefore cool differently.) Why should we record the temperature every minute and not just after 5 minutes? (Depending on the fan speed and the room temperature, the water may reach room temperature in less than 5 minutes. The additional readings give the students more information about the cooling.)
After the students have collated their data, they should examine it for relationships, preferably with the aid of suitable graphs. They should find that the more wind, the faster the water cools. The slope of the graphs should make this clear.
All estimates will be very rough. Discuss why. (The wind speed [10 km/h] given for the fan is an estimate. The cooling effect of wind is not linear: a 50 km/h wind does not feel twice as cold as a 25 km/h wind. The cooling effect of the wind depends on air temperature as well as wind speed.)
As always with an activity involving estimation, remind your students that an estimate is different from a guess; estimates should always be based on data.
Points of entry: Science
This activity introduces the idea of heat transfer. Heat energy tends to move from a warm body to a cold body, so a bowl of hot water in a cool classroom will lose heat energy to the atmosphere.
As with any experiment, challenge the students to describe what makes the experiment scientific and to identify possible sources of error. For example, if the thermometer is touching the bowl, they may be measuring the temperature of the bowl, not the water. Ask Why did we record the cooling for “no fan”? (Only by knowing how much the water cools without assistance can we work out how much of the cooling is caused by the fan.)
Encourage the students to relate their data to real-life contexts. Ask: Why are windbreaker jackets thin? (You only need a thin windproof layer to prevent wind chill. For cold air temperatures, you need insulation, regardless of whether there is wind or no wind.)
Discuss the dangers of drawing universal conclusions from the experiment. (The data is very limited, may contain errors, and may not be valid across a range of temperatures.)
The students may be familiar with wind-chill charts or charts in newspapers showing temperatures adjusted for wind chill. Wind-chill charts are subjective; there are several competing methods of equating wind speed to apparent temperature difference. Remind the students that the cooling effect of wind depends on air temperature as well as wind speed because the wind doesn’t actually change the temperature. Reinforce the idea that being outside in windy, wet, and cold conditions can be deadly and that even experienced trampers can suffer from wind chill (see the later investigation on hypothermia).
Answers
Activity
1. a.–b. Practical activity and recording of results. Question 1a, without “wind”, is the control experiment. The rate of cooling in each trial will depend on many factors, including the strength of the fan, the room temperature, and the shape and thickness of the bowl. Here is a possible data set:
| Wind Chill Experiment | |||||
| "Wind" | Water Temperature (Cº) | ||||
| 1 min | 2 min | 3 min | 4 min | 5 min | |
| No fan | 34 | 32 | 31 | 30 | 29 |
| Low | 33 | 31 | 30 | 29 | 28 |
| Medium | 32 | 29 | 27 | 25 | 24 |
| High | 31 | 27 | 25 | 23 | 22 |
c. Graphs will depend on the data. Here is a line graph for the above data:
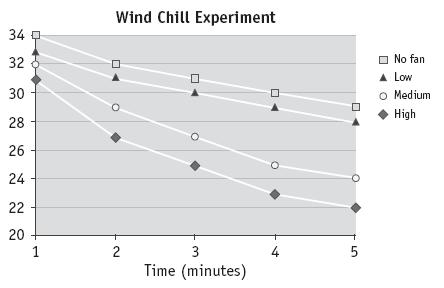
d. Answers will depend on the actual data. However, more “wind” should cool the water faster. For example, the water will be closer to room temperature after 3 minutes for the high-fan setting than for the medium-fan setting. But once the water reaches room temperature, it will not cool further.
2. a.–b. Answers will depend on the actual data. The following table shows temperature loss over 5 minutes and energy transferred from water to air for the sample data listed above (question 1a–b).
| Wind Chill Experiment | ||
| "Wind" | Water Temperature (Cº) | |
| Loss over 5 min (ºC) | Energy transferred from water to air (J) | |
| No fan | 37 - 29 = 8 | 8 x 4 180 = 33 440 |
| Low | 37 - 28 = 9 | 9 x 4 180 = 37 620 |
| Medium | 37 - 24 = 13 | 13 x 4 180 = 54 340 |
| High | 37 - 22 = 15 | 15 x 4 180 = 62 700 |
3. Answers will depend on your data. Subtract the control (no fan) energy loss from the high-fan energy loss. For the sample data, 62 700 J is lost with high fan and 33 440 J is lost with no fan, so 29 260 J (62 700 – 33 440 = 29 260 J) is due to the “wind”.
4. a. Estimates will vary. You will need to assume that energy loss in a 30 km/h wind is roughly 3 times as great as in a 10 km/h wind (the high-fan setting). Also note that the estimate required is for 1 hour, which is 12 times as long as the period in your experiment (12 x 5 = 60 minutes). This means you should multiply your answer to question 3 by 3 x 12 = 36 to get an estimate.
For example, if the high-fan setting causes a net energy loss of 29 260 joules (J) in 5 minutes, a 30 km/h wind might cause an energy loss of 29 260 x 3 x 12 = 1 053 360 J (1 053 kJ). Given that this is a very rough estimate, it should be rounded to 1 000 kJ.
b. Answers will depend on your estimate in 4a. If Henry loses about 1 000 kJ per hour due to the wind, then he will lose 1 000 ÷ 150, or about 7 apples’ worth, of energy per hour.
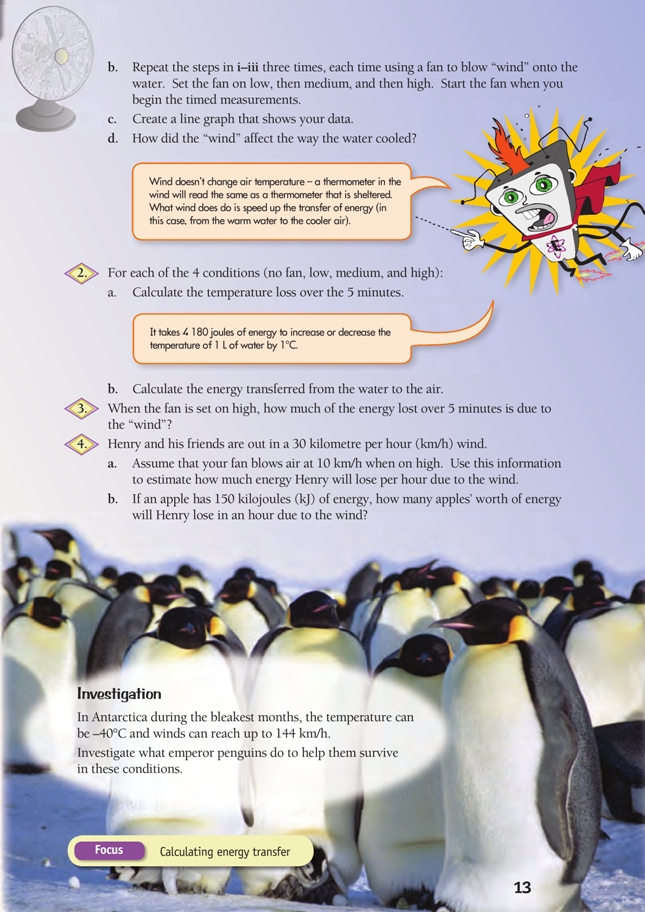
Investigation
Research results will vary, but you should discover that Emperor penguins huddle together to conserve energy. Those on the outside lose energy much more rapidly than those on the inside. To ensure that all survive, they systematically shuffl e. Every penguin takes a turn at bearing the brunt of the wind before returning to the warmth of the huddle.