This is a level 3 statistics activity from the Figure It Out series.
A PDF of the student activity is included.
Click on the image to enlarge it. Click again to close. Download PDF (1558 KB)
answer questions from a chart
make a conclusion based on data
comapre and discuss conclusions with a classmate
This diagram shows the areas of Statistics involved in this activity.
The bottom half of the diagram represents the 5 stages of the PPDAC (Problem, Plan, Data, Analysis, Conclusion) statistics investigation cycle.
Classmates
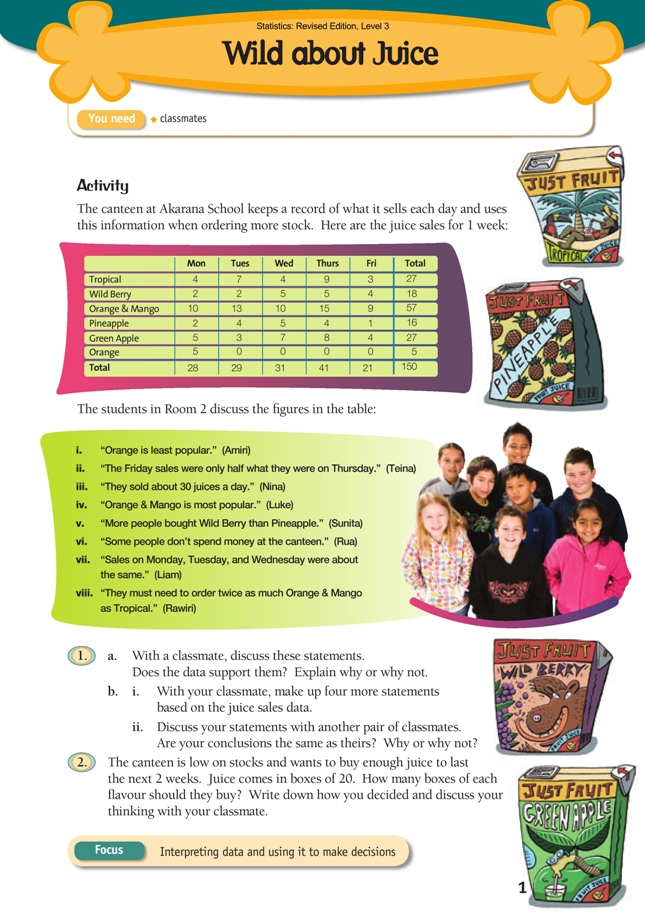
In question 1, the students must analyse the category data* presented in the table before they can agree or disagree with the statements made by the students in Room 2 and make up their own. Encourage statistical argumentation, insisting that it be settled with reference to the evidence in the table. Have the students report their fi ndings to the class. The different statements in the activity can be used to help students learn the difference between acceptable generalisations and sweeping assumptions.
It is noteworthy that Orange was the second-best-selling juice on Monday but achieved zero sales for the rest of the week. This poses a problem of interpretation: did no one actually want Orange on the remaining 4 days or had the canteen run out? If the canteen ran out on Monday, was it during or at the end of lunchtime? Obviously there is no way of knowing, but it is worth exploring the implications of the different scenarios and seeing if it is possible to get agreement on the “balance of probabilities”. Amiri’s assertion that “Orange is least popular” raises the issue,
and it is a complication in question 2.
In question 2, the students need to divide their totals by 20 and make statements regarding future canteen purchases. Encourage them to explain their answers as fully as possible. For example: “The canteen needs to purchase 3 boxes of Tropical because in 1 week they sold 27 Tropical. This means that they could sell 54 Tropical in 2 weeks. 54 is close to 60, so they should order 3 boxes of 20, even if some may be left over.” It is particularly important that students understand that while extrapolations of this kind have to be made all the time (how else do shops maintain stocks?) they are far from certain in terms of outcomes. It may be that, next week, Tropical is the best seller and Orange & Mango gathers dust on the shelves!
Answers to Activity
1. a. Discussion will vary. Possible comments include:
i. Based on the data, Amiri is correct that overall, Orange is the least
popular juice (although not on Monday). It may be, however, that the canteen ran out of Orange on Monday and that this is the reason why there were no sales on any of
the other days in the week.
ii. There were 41 sales on Thursday and 21 on Friday, so this is a fair
statement.
iii. Sales were 28, 29, 31, 41, 21, which balances out to about 30 a day.
However, Nina would have been more accurate if she had said, “On
average, they sold about 30 a day.”
iv. Luke’s statement is true. Only one other drink, Tropical (on Thursday),
matched the lowest sale of Orange & Mango (on Friday).
v. There were more sales of Wild Berry (18) than of Pineapple (16) over the
course of the week, but the same people may have bought those flavours on different days, so stating that “more people bought Wild Berry” may not be correct.
vi. You would have to know the school roll and who actually purchased
juice to know if the data supports Rua’s statement.
vii. With sales of 28, 29, and 31, the data does support Liam’s statement.
viii. Based on this week’s fi gures (27 sales of Tropical and 57 sales of Orange &
Mango), the data supports Rawiri’s statement.
b. i. Statements will vary. Some examples include:
“Friday is the least popular day for buying juice.”
“Green Apple is just as popular as Tropical.”
“The canteen may have run out of Orange on Monday.”
ii. Discussion and conclusions will vary, but the conclusions must be
able to be backed up from the data.
2. Discussion and reasons for the decisions will vary, but one possible purchase order could be:
Any decision should be based on the relative popularity of each fl avour for the week covered by the data. You will need to decide what to do about Orange. If you assume that the canteen ran out of Orange on Monday, you might suggest 3 cartons of Orange on the grounds that Orange and Green Apple were equally popular
on Monday. Then again, maybe they ran out of Orange part-way through Monday and would have sold more than 5 …
Key Competencies
Wild about Juice can be used to develop these key competencies:
• thinking
• participating and contributing.