The purpose of this activity is to engage students in identifying possible outcomes in a given situation and describing the chance of an outcome occurring in broad terms.
This activity assumes the students have experience in the following areas:
- Using everyday language to describe the chance of an event occurring.
- Ordering events by likelihood.
- Exploring simple probabilistic situations in which all the outcomes can be listed.
The problem is sufficiently open ended to allow the students freedom of choice in their approach. It may be scaffolded with guidance that leads to a solution, and/or the students might be given the opportunity to solve the problem independently.
The example responses at the end of the resource give an indication of the kind of response to expect from students who approach the problem in particular ways.

Imagine you have an envelope with one yellow counter and three blue counters in it.
- If you take out one counter without looking, what colour might it be?
- What colour is it most likely to be?
- If the counter you took out was yellow and you decided to take out another counter, what colour might the second counter be? Explain your answer.
The following prompts illustrate how this activity can be structured around the Statistical Enquiry Cycle.
Problem
The problem section is about what data to collect and who to collect it from and why it’s important.
- What are my investigation questions? (Which colour is most likely to be picked first? If yellow is picked first what colour is the second pick?)
- What information have I got? Do I need any more information?
- Am I clear how the envelope game is played?
- What will answers to my questions be like? (Decisions about the likelihood of yellow and blue for first pick and prediction of outcome for second pick are both needed. The positions must be explained or justified.)
Plan
The planning section is about how students will gather the data.
- How will I go about answering this question?
- Could I act out the game with another person?
- Could I just think about the game to answer the question, imagine it?
- What would I need to think about?
Data
The data section is concerned with how the data is managed and organised.
- What things do I need to try out the envelop game?
- How many games should I try? (Both first and second picks are needed)
- How will I record what happens for the first and second picks?
- Do I expect the same thing to happen each time, or will each game be different? Why?
Analysis
The analysis section is about exploring the data and reasoning with it.
- Have I looked at the results of the games?
- Do the results help me to answer the questions?
- How often does yellow come up on the first pick?
- What yellow comes up first, is the second pick always blue? Why?
- What happens most, two blues, two yellows, or a mix of yellow and blue?
- How are the results the same or different to what I first thought?
Conclusion
The conclusion section is about answering the question in the problem section and providing reasons based on their analysis.
- Have I answered my questions? If not, why not?
- What are my answers?
- How do I use my results to convince someone else I am right?
- Do my thinking and result match? If they do not match, can I rethink about the game?
- Why are two yellows impossible? Which happens more often, blue-blue or yellow-blue? Why does this happen?
- What maths or statistics do I need to learn to make more sense of games like this?
Examples of work
Work sample 1
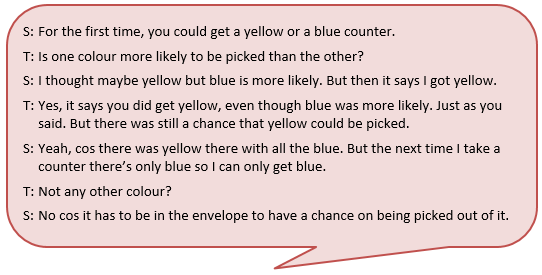
The student considers all the possible outcomes of the first pick visually in predicting that blue is more likely. Assuming a yellow comes out they claim that blue is the only possible outcome of second pick.
Click on the image to enlarge it. Click again to close. 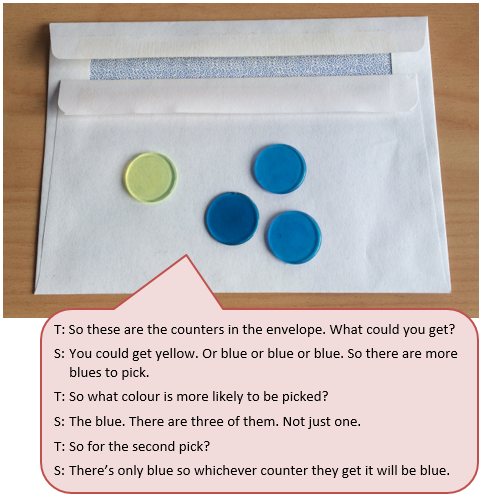
Work sample 2
The student considers the contents of the envelope by imaging and predicts the blue is more likely for the first pick. They accept that a yellow counter is possible for first pick and conjecture that only blue can then be taken on the second pick.
Click on the image to enlarge it. Click again to close.