This is a level 3 algebra strand activity from the Figure It Out series.
A PDF of the student activity is included.
Click on the image to enlarge it. Click again to close. Download PDF (244 KB)
use a graph to show a relationship in sequential patterns
number line (optional)
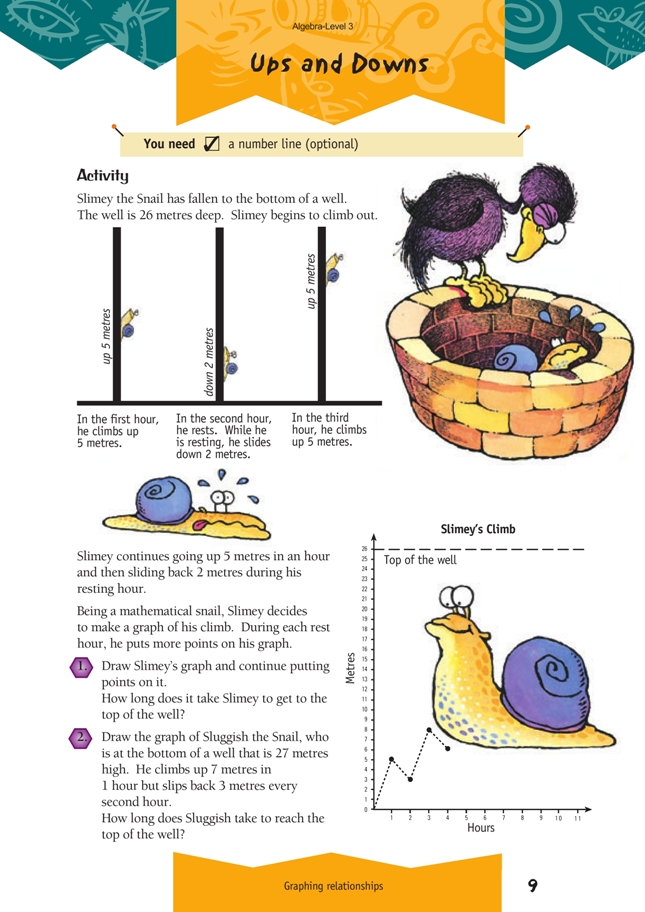
This activity requires students to construct two graphs of the movements of two different snails. The graph at the bottom right-hand side of the page models the correct procedures for labelling and setting out graphs.
Students could calculate the number of hours, but generally they will draw the pattern on the graph. Make sure that they start plotting their graph on the left-hand side of their page as the snails may take more hours than they would expect.
As a discussion point, if students calculate the number of hours, they may see that over a period of 2 hours, Slimey climbs a total of 3 metres. Dividing 26 metres by 3 metres and multiplying it by 2 hours gives a total of 17.3 hours. The catch is that Slimey reaches the top during one of his 5 metre ascents rather than after a 2 metre slide down. Students’ graphs should show that Slimey reaches the top in 15 hours (presuming that he remains resting at the top of the well rather than sliding down again!).
Sluggish the Snail’s climb is along similar lines, but the rate is different. As an extension exercise, students could compare the slope of each graph. If the slopes are different, the snails must have been moving at a different speed. Ask students “Would a steeper slope mean that that snail is faster or slower? Is Slimey faster or slower than Sluggish?”
Answers to Activity
1. Slimey’s Climb
It takes Slimey 15 hours to get to the top of the well.
2. Sluggish’s Climb
It takes Sluggish 11 hours to get to the top of the well.