This is a level 4 measurement strand activity from the Figure It Out series.
A PDF of the student activity is included.
Click on the image to enlarge it. Click again to close. Download PDF (214 KB)
interpret a tide chart
FIO, Level 4+, Measurement, Book Two, Time and Tide, page 17
This may be the first time that your students have met a cyclical time-series graph. If your school is near the coast, you may have students who love fishing and who understand the way tides work even if they aren't sure about what causes them. Because of New Zealand's coastal nature, most students will have had at
least some first-hand experience of tides. You can build on this.
Tides are caused by the gravitational pull of our moon on the oceans. As the Moon orbits the Earth, we say that it rises and sets. Where the Moon is directly above, the oceans below experience a high tide (and, interestingly, so do the oceans on the opposite side of the Earth). The Moon orbits the Earth once approximately every 25 hours, so there are 2 high tides and 2 low tides within this time. Neap and spring tides are caused when the Sun also affects the tides and gives greater gravitational pull to the Moon (spring tides) or reduces the effect of that pull (neap tides).
Questions 1 and 2 ask the students to read values directly from the graph, but question 3 involves some interpretation. The steeper the curve, the greater the rate of change (in this case, of tide level). Relate this to your students' personal experiences of tides. If they have ever made sandcastles on the beach at the high tide point, they will know that there is a period when it is hard to know if the tide is coming in any further or not. This period (represented by the crest of the peaks on the graph) may last for 10 or 15 minutes. During this time, their construction is under threat. And then they realise that all danger has passed. The tide is now on its way out.
Discuss with your students how the slope of the graph changes as the tide rises and falls. Use the opportunity to talk in terms of positive and negative slope (a positive slope goes uphill as your eyes scan it from left to right, and a negative slope goes downhill). In this case, a positive slope represents an incoming tide. Ask your students how they could describe the slope of the graph at its peak. They should be able to recognise that, at this point, the slope is neither positive nor negative. The slope is therefore 0, the only number that is neither positive nor negative.
In question 5, the students need to make use of the fact that the graph is cyclical to predict when the next high tide will be. The key to the prediction is recognising that the period of the graph (the time taken for one complete cycle) is very nearly 12:30 hours. This means that if it is high tide at 5 a.m. this morning, the next high tide will be at approximately 05:00 + 12:30 = 17:30 hours (5.30 p.m.) this evening.
Let your students discuss question 6 for some time if necessary and avoid confirming the correct answer the moment someone suggests it (if they do!). Let them think of possibilities and then challenge them to think of reasons for retaining or discarding each of them. Hopefully someone will come up with the very important idea that tide tables are always predictive (published in advance). This means that, whatever the cause, it was able to be predicted with complete accuracy days or even weeks in advance. This rules out tsunami, cyclones, earthquakes, and the like. We do not know when these events will hit, nor do we know what the exact effects will be. The answer is not that something dramatic and unusual has happened to the tides but
that something has happened to the time. Because of the introduction of daylight saving, part of the graph has been translated 1 hour to the right. The odd break in the curve reflects the human manipulation of time.
OceanFun Publishing, who created and supplied the graphic in the students' book have a website:
www.ofu.co.nz/graph/tides.htm Students can use this site to find the tides for each day at many different places around the New Zealand coastline.
Cross-curricular links
Science
Students could investigate the relationship between the Sun, the Earth, and the Moon, using the Ministry of Education's digital learning object Day and Night, which can be found at www.tki.org.nz/r/science/day_night/index_e.php
Students could also investigate how Māori used the phases of the Moon as a guide for planting foods.
Achievement Objective
- investigate and use models which explain the changing spatial relationships of the Earth, its moon, and the Sun, and the way different cultures have used these patterns to describe and measure time, and position (Making Sense of Planet Earth and Beyond, level 4)
Answers to Activity
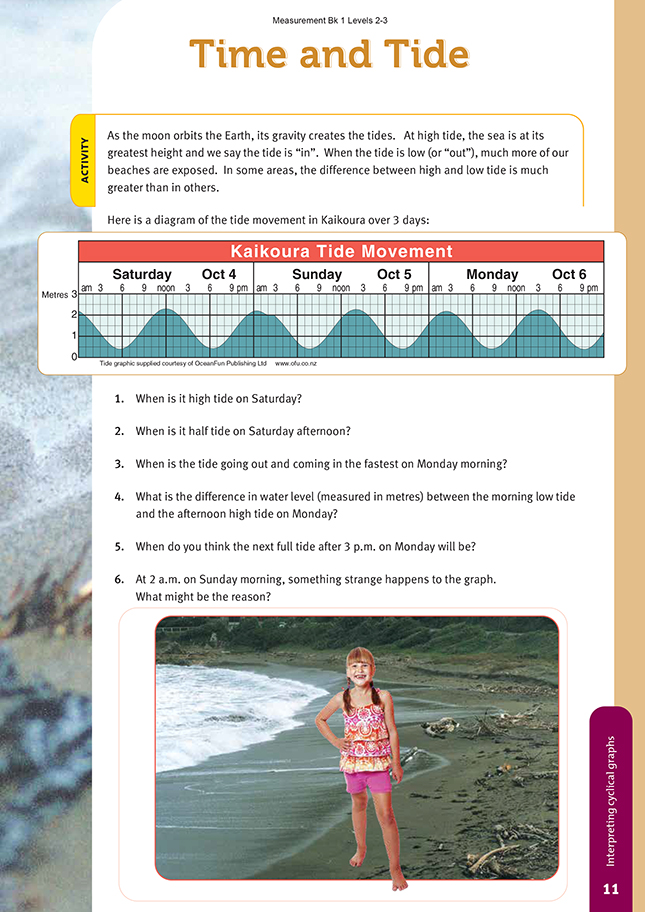
1. Approximately 12 p.m. (noon)
2. Approximately 3.10 p.m.
3. Approximately 5.30 a.m. and 11.50 a.m.
4. Approximately 1.85 m. (2.25 - 0.4)
5. Approximately 3.30 a.m. on Tuesday
6. The reason is the start of daylight saving. Tsunami or other natural causes can't be the explanation because tide tables are prepared weeks or months in advance and such causes can't be predicted.