These are level 3 number, geometry, and measurement problems from the Figure It Out series.
A PDF of the student activity is included.
Click on the image to enlarge it. Click again to close. Download PDF (362 KB)
explain tenths and hundredths place value (Problem 1)
identify faces, vertices, edges on three dimensional shapes (Problem 2)
compare graphs for representing informations (Problem 3)
solve problems involving capacities (Problem 4)
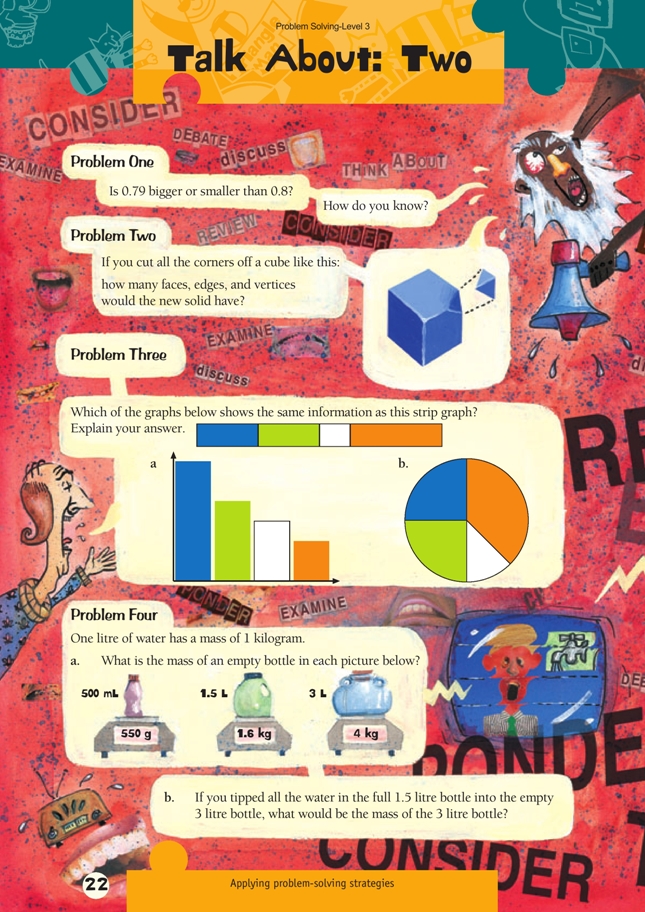
Problem One
This problem confronts a common error that because 79 is greater than eight, 0.79 must be greater than 0.8. This misconception occurs when students ignore the significance of the place of each digit.
Students could use place value blocks to model the two numbers. We assume firstly that
 (the flat) is one,
 ![]() is one-tenth because 10 of them make one, and
is one-tenth because 10 of them make one, and ![]() is one-hundredth because 100 of them make one.
is one-hundredth because 100 of them make one.
Students will see that one-hundredth must be added to 0.79 to make it 0.8.
Students could be asked how many hundredths are in both numbers (79 for 0.79 and 80 for 0.8). If 0.8 were written as 0.80, it would be obvious that it is greater than 0.79.
On a tape measure, 79 centimetres comes before 0.8 metres.
![]()
Problem Two
Cutting the corners off a cube creates a polyhedron known as a truncated cube (truncated means cut off). A model made from Plasticine or a large potato can be used to help visualise the solid created.
The original cube was made of six square faces, 12 edges, and eight vertices (corners).
A consequence of cutting the cube at each vertex is that each square becomes a regular octagon and an equilateral triangle is formed at each previous vertex.
So the truncated cube has six octagonal faces and eight triangular faces, giving a total of 14 faces.
For each previous vertex, there are now three vertices, so the number of vertices is 3 x 8 = 24. All of the original 12 edges of the cube are still present in truncated form. Added to them are the three sides of each of the eight triangles. So the number of edges is
Problem Three
By inspecting the strip graph, students will see that half the data set is divided into two quarters, with the remainder being split into 1/8 and 3/8.
The pie graph also has these ratios.
All the lengths of the bars on the bar graph are different, so it cannot represent the same data set as the strip graph. Encourage students to draw an accurate bar graph of the data. For example:
Problem Four
One litre of water has a mass of 1 kilogram (1 000 grams), so students can find the mass of each empty bottle by taking the mass of the water from the total mass of the bottle. In each case:
550 – 500 = 50 grams
1 600 – 1 500 = 100 grams
4 000 – 3 000 = 1 000 grams
= 1 kilogram
The 3 litre bottle has a mass of 1 000 grams, so adding 1.5 litres of water (1 500 grams) will give it a total mass of 1 000 + 1 500 = 2 500 grams.
Answers to Problems
1. Smaller. 0.79 is 79/100 and 0.8 is 80/100.
(A number line would show that 0.79 comes before 0.8.)
2. 14 faces, 36 edges, 24 vertices
3. The pie graph (graph b). The ratios of the strip and pie graphs are 1/4, 1/4, 1/8, and 3/8. The bar graph has 4 different lengths.
4. a. 500 mL bottle: 50 g; 1.5 L bottle: 100 g (0.1 kg); 3 L bottle: 1 kg
b. 2.5 kg