This is a level 3 activity from the Figure It Out series.
A PDF of the student activity is included.
Click on the image to enlarge it. Click again to close. Download PDF (903 KB)
Statistical thinking involves the exploration and use of patterns and relationships in data. There are four key processes:
- describing data – connecting the information in a table or graph with a real-life context
- organising and reducing data – ordering, grouping, and summarising data
- representing data – creating visual representations
- analysing and interpreting data – recognising patterns and trends and using them to make inferences and predictions.
In these activities, the students use measurement data to determine a suitable length for a rat-costume tail.
grid paper
a calculator
chalk
a tape measure or a metre stick
group data sheet (see copymaster)
group of classmates
FIO, Creative Technology, Levels 2+-3+, Tailspin, pages 14 - 15
In this activity, students collect data to help make decisions and create a scale drawing of a school stage.
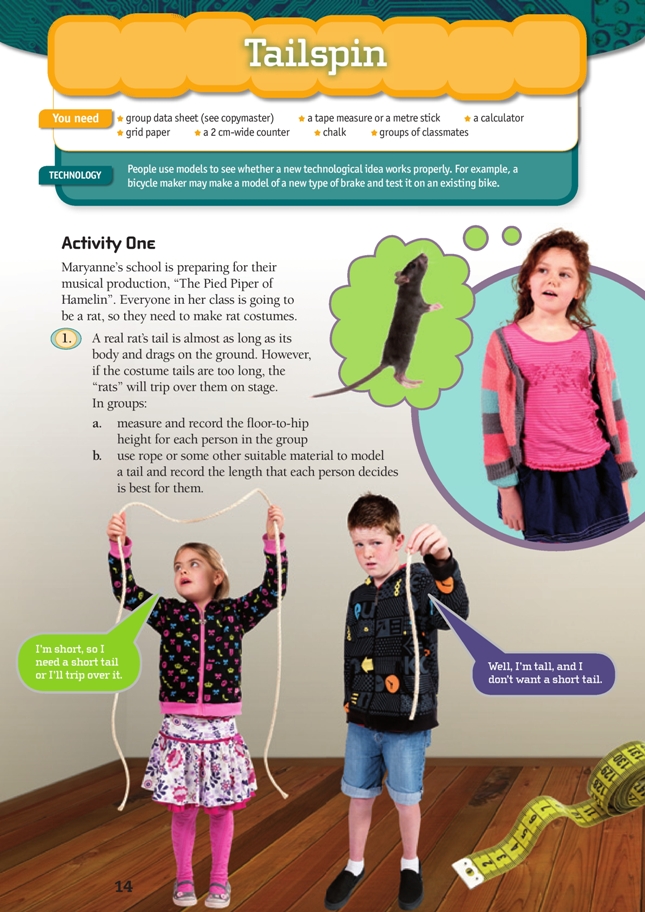
Activity One
This activity provides an example of using data to inform decisions.
Statistical investigations should begin with a question or problem. In this situation, the problem is: How long should the rats’ tails be?
It can be hard to see a pattern within a list of numbers, but when the information is displayed as a dot plot, groups within the data are revealed. Students can decide whether to make the tails a uniform length or to provide sizes (long, medium, short). Alternatively, the length of the tail could be based on individual differences, for example, 5 cm shorter than the hip-to-floor length.
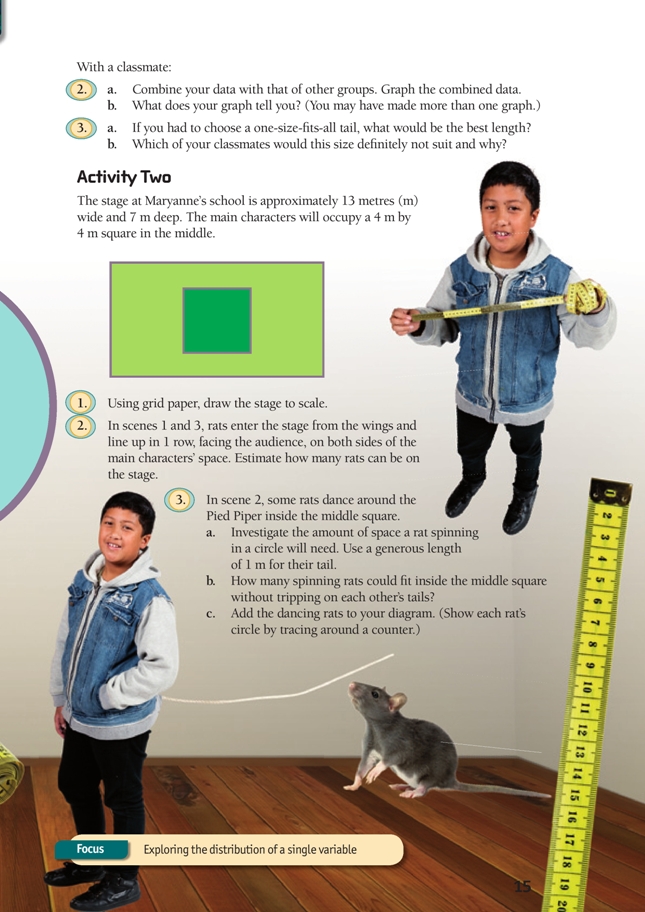
Activity Two
Use a student to demonstrate how much space a person needs when they are spinning with a tail. Use a piece of rope to show that the spinning tail forms a circle. Pin one end of a piece of string to the carpet. Fix a piece of chalk to the other end and rotate the string to create a circle. Explore the relationship between the length of string and the circle it creates. Using a 1 m rope will make question 2 easier.
Question 3 will help the students to see the relationship between their scale drawings and real life. Consider using chalk to draw the positions from model drawings onto the school stage. The students can stand on a chair to view chalk markings from a bird’s-eye view.
These activities provide an opportunity for students to develop the key competency thinking by creating models and using statistical information to make decisions.
Technology-related student activities
Explore the following scenarios to make products that are “fit for purpose”:
- The board of trustees is planning to make sunhats compulsory. Make dyed models out of muslin to explore which colour is preferable to the students, parents, and the board of trustees and which is most effective.
- Make photo frames for presents. Experiment with cardboard to determine the best design for stands.
- The school wants to advertise its upcoming production. Make models of posters with cheap paper to investigate the best fonts and colours.
Exploring the technology-related context
“Fit for purpose” is an important concept. Developers of new products need to know if they will do what they are designed to do, but they may wish to avoid the expense of making a prototype only to discover that it is a costly mistake. Developing functional models of new systems or mechanisms may help this to be avoided. (For rats’ tails, the tail has to be the right weight so that it doesn’t just wrap around legs as the rat spins.)
Answers
Activity One
1. a.–b. Practical activity. Information will vary, depending on the individual measurements of class members.
2. a. Data and graphs will vary. Consider this sample data:
| Student | Floor-to-hip height (in cm) | Preferred tail length (in cm) |
| Rangi | 78 | 60 |
| Angela | 81 | 75 |
| Peter | 77 | 68 |
| Arun | 80 | 69 |
| Toby | 78 | 68 |
| Moira | 79 | 67 |
| Maryanne | 78 | 60 |
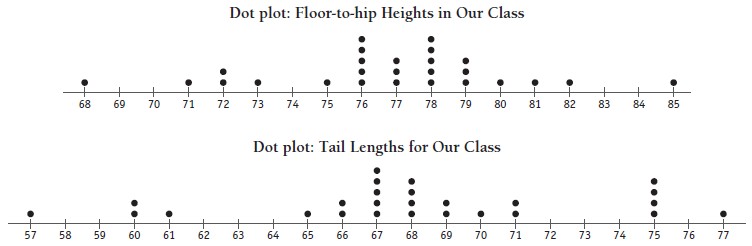
b. Conclusions from graphs will vary. The sample graphs show a large range of heights and preferred tail lengths. Most of the sample students would suit a tail between 65 and 71 cm.
3. a. One option is find an “average” tail length that lies in the middle of the data, for example, 67 cm. However, a safer option would be to choose a tail length that suits the shortest person in the class.
b. Answers will vary. In this example, a 67 cm tail might be too long for the shortest person in the class.
Activity Two
1.–2. Drawings will vary. There is 9 m of space left for the chorus (13 m – 4 m for the centre square). If the rats are 50 cm (0.5 m) wide, 2 rats will fi t in each metre. 9 x 2 = 18 rats. For example, with the rats drawn in: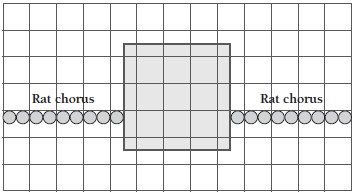
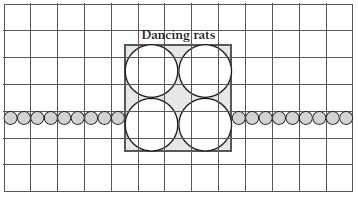
3. a.–b. Each spinning rat will make a circle with a radius approximately equal to the length of the rat’s tail (imagine spinning round with your tail swinging at full stretch). If each rat has a 1 m tail, then each circle will be 2 m wide. The centre square is 4 m x 4 m, so only 2 spinning rats will fit across the bottom and 2 will fit across the top.
c. Diagrams will vary. For example: