This is a level (2+ to 3+) mathematics in science contexts activity from the Figure It Out series.
A PDF of the student activity is included.
Click on the image to enlarge it. Click again to close. Download PDF (1025 KB)
Students will:
- gather, sort, and display data on weight, length, and period (the time it takes to swing forwards and backwards [1 swing])
- using that data, communicate findings and make predictions.
Students should discover that:
- the longer the length of the rope, the greater the period for each swing.
a sealable bag, string, weights such as coins or metal washers, and sticky tape (to make some swing models)
a computer spreadsheet/graphing program
recording tables (see copymaster)
a classmate
FIO, Forces, Levels 2+-3+, Swing Time, pages 16 - 18
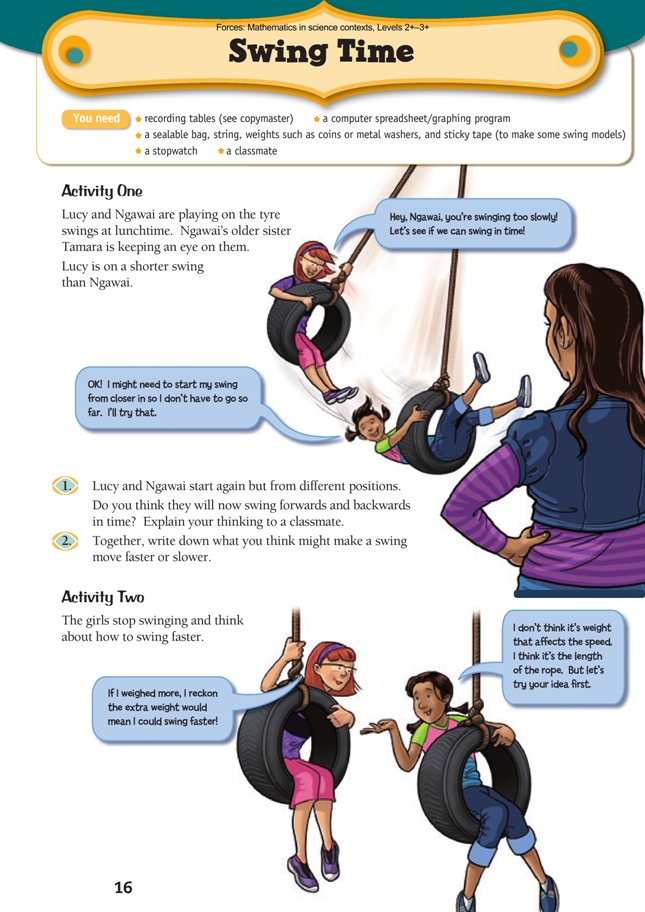
Activity One
Preparation
Structured play on real swings is a good introduction. For example, ask the students to try to swing forwards and backwards in time with each other. They could try this: with and without body movement, someone just letting them go from a height, or that person giving them a push-off at the start.
Points of entry: Mathematics
Introduce or reinforce the idea of variables*. Ask What are all the things we can change when we are using swings? Applying creative thinking to a practical context like this is a good opportunity to focus on the key competency thinking.
Points of entry: Science
Activate the students’ prior knowledge about swings through open-ended questioning, for example, What do you know about swinging?
Students could answer question 1 by experimenting on swings (see Preparation) or you might want to have them to move a model (which they are asked to do in question 2). This investigation could be carried out using a real swing, but models will be more easily managed by a large number of groups and take less time. Modelling is common practice for scientists. Ask How would a scientist look at a swing set? (Note that model swings will not be able to take into account questions that the students may have about the effect of body movement. The activities in Swing Time investigate length and weight without variables such as body movement, but you could have some very interesting discussions with your students after the trials.)
Generalise a swing as a pendulum. Ask: What is a pendulum? Where else do we see pendulums?
Remind the students about gravity: unless you get a push or pump your legs, swings are powered by gravity. Discuss with them the effect of getting a push or pumping with their legs. (Both these actions result in extra force being exerted. The extra energy will give added height but will not make any difference to the time taken for 5 swings – the swing will just move faster as it covers the extra distance.)
Answers
Activity One
1. Answers will vary, but even if the girls start at different positions, their swings won’t synchronise.
2. You might suggest aspects such as the weight of the person on the swing, the length of the rope, the position of release, how much force is applied to push the swing, and how much body movement the person on the swing puts into swinging forwards and backwards. (You’ll be investigating some of these ideas later.)
Activity Two
Preparation and points to note
As with any group activity, carefully consider the needs of individual students. Ensure that the weights used are identical.
Remind the students that they should time their model for 5 swings and that 1 swing is 1 movement forwards and backwards.
Encourage the students to think about why they need to put all the weight on the same part of the string. Weights spread up and down the string will have varying effects on the period of the pendulum swings, in other words, they would be testing weight and length at the same time.
Students may think that weight will affect the period of the swings. Let them discover that it doesn’t.
Points of entry: Mathematics
This activity is a good example of the use of the statistical enquiry cycle: problem, plan, data-gathering, analysis, conclusion. Point out how this process could be applied to any investigation that involves the comparison of variables.
Tables and graphs are ways of representing information and ideas and, as such, are part of the key competency using language, symbols, and texts that can be applied to this activity. The thinking needed for evaluating results is another relevant key competency.
Explore fair trials and ideas of fairness by using seemingly unfair methods, for example, starting from obviously different starting points or pushing the swing forwards rather than just letting it go. (In the first example, the students should find that it makes no difference to the periods recorded. In the second, it affects the speed of the first “swing”.)
In question 2, the students decide how to represent their data. Encourage them to argue for or defend their choice of graph. Ask Why do we use graphs and tables for data? (It’s to help see patterns more easily and clearly.)
Use the multiple trials to discuss experimental error. Ask: Why might two trials have different results? What might cause error?
Ask the students to apply their knowledge to other settings. For example, What would shortening the pendulum of a clock do? (Shortening the length of the pendulum will increase the number of swings per minute and so speed up the clock.)
Points of entry: Science
Statistical and scientifi c inquiries follow the same method (see page 5). Repeat scientific vocabulary like hypothesis, fair trial, and conclusion. Make links to other investigations that the class has performed using the scientific inquiry method.
Encourage groups to compare their results. Ask: Are the results similar? For example, do two groups draw the same conclusion? Why would this be important? As an alternative, the class could collate the averages (means) from all groups and graph them and then discuss overall class results. Discuss how this could give a more valid picture, for example, by having a larger sample size or more repetitions.
Answers
Activity Two
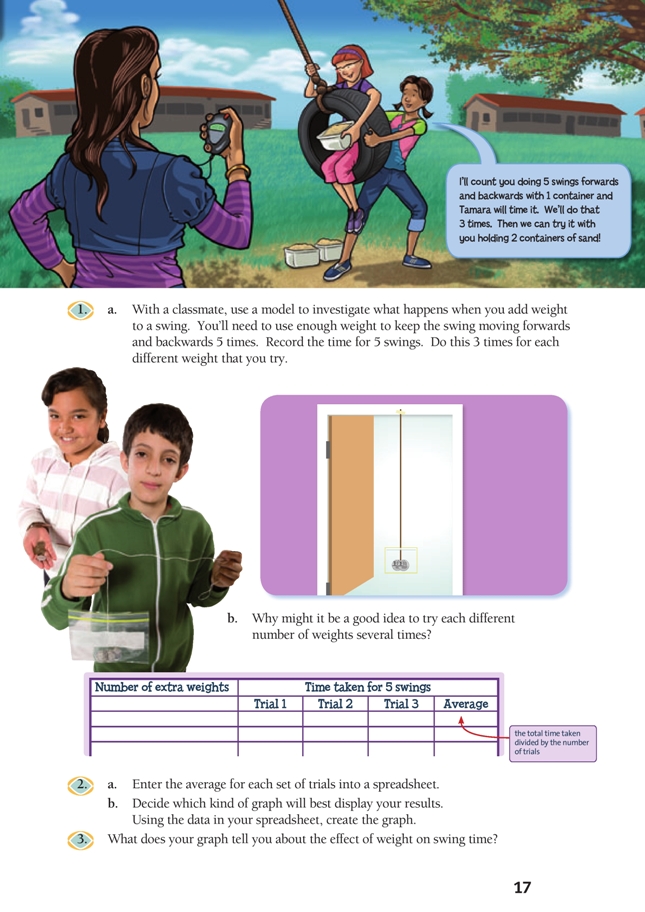
1. a. Practical activity. Your plans about the process need to be reasoned and manageable. For example: “How many times will we repeat each weight?” You might also think about fairness, for example: “Would it be fair if, for the first trial of a weight, the person on the swing used body movement and for the next trial they didn’t?”
b. Repeating the experiment a number of times for each different number of weights will make the findings more valid. You will get a fairly accurate result if you find the average (mean) because although you might make a mistake on one trial (for example, not clicking the stopwatch at the right moment) you probably won’t make the same mistake every time.
2 a. Results will vary. Your table should show similar times for 5 swings for every trial, no matter how many weights you use.
b. Although the choice of graphs will vary, they should have 2 variables, for example, as in a scatter plot. Be careful of the scale: the computer may automatically scale it so that it looks like there is a lot of variation, but the variation will actually be very small. Results should produce a roughly horizontal
line, showing that weight does not affect the period of the swing if all other factors are kept constant.
3. Adding more weight will not change the period of a swing if everything else is kept constant. Your graph should show that weight has no real effect on swing period.
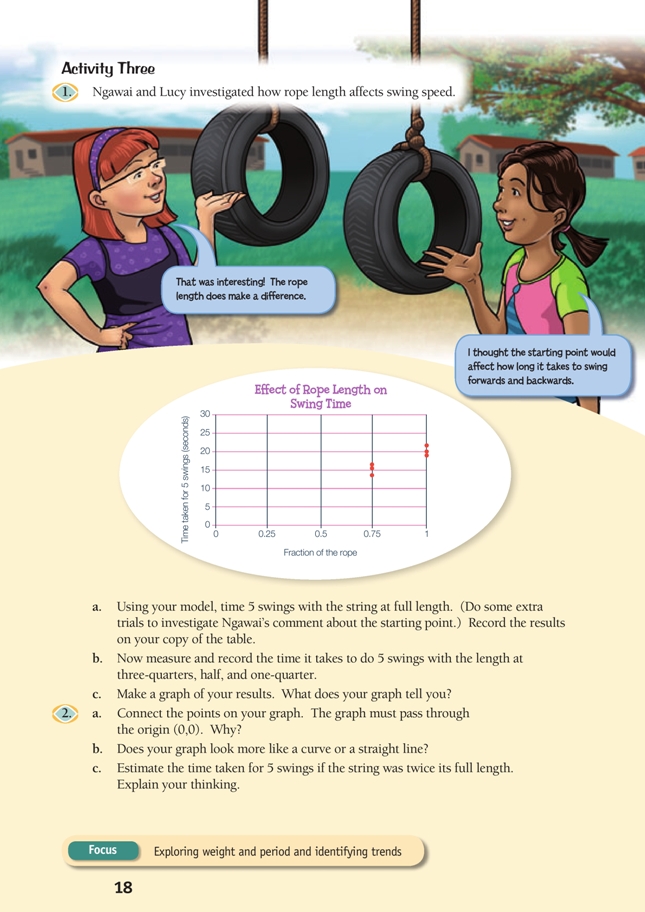
Activity Three
Preparation and points to note
The students will probably want to use their rulers to measure rope length. Consider asking them to find fractions like three-quarters without a ruler, for example, by looping a string in half, then half again, mark the quarters, and reduce the length by one-quarter. (Note that the true length of the pendulum in each case includes the weight on the end.)
In this activity, students need to make sense of information, their own experiences, and the ideas they come up with, so the key competency thinking is applicable. For example, the students are not asked specifically to do more than one trial for each length here, but they have done this in Activity Two and discussed why, so encourage discussion of this for Activity Three. (It is obvious from Lucy and Ngawai’s graph that they did more than 1 trial for each length.)
Interestingly, students could vary the weight in different trials of length without affecting the result. However, good practice requires that they keep the weight the same (as noted in the answers).
Points of entry: Mathematics
In this activity, Lucy and Ngawai don’t average the trials in their graph; rather, each trial is represented as a separate data point. Have the students compare and contrast this approach with using a single average (mean) point to represent all the data gathered at each length.
The relationship between period and string length is not linear. Doubling the length of the string won’t make it go exactly twice as fast. The students will need to estimate the effect of different string lengths. Question 2 introduces the opportunity to talk about linear behaviour (straight lines) and non-linear (curves). For example, the area of a square is not linear because if you increase the length of its side, the area increases exponentially.
| Side of a square | Area |
| 1 | 1 |
| 2 | 4 |
| 3 | 9 |
| 4 | 16 |
[Note to teachers. Pendulums are based on the geometry of the circle. Increasing the length of the pendulum is the same as increasing the radius of the circle described by the path of the weight on the pendulum end. In other words, lengthening the pendulum increases the distance the pendulum travels on each swing according to the relationship between radius and circumference (C = 2πr).]
Points of entry: Science
Students may question why a longer pendulum takes longer to do 5 swings. The relationship between length and speed is complex. Put simply, longer pendulums take longer to do 5 swings because they travel a greater distance both vertically and horizontally. Longer pendulums fall further and therefore accelerate more due to gravity, but they also have a much longer arc to travel.
Answers
Activity Three
1. a. Practical activity. Counting the time for 5 swings when the string is at its full length will give you comparison data to use in the other trials of different lengths. (You may have discovered from Activity Two that Ngawai was not right in what she initially thought. If you pull the string or rope further back, the swing will go higher at the other end but will still take the same time for 5 swings at that rope length as it does from further in.)
b. Results will vary. (It’s good practice to use the same weight for each trial.) You can measure the string and change the length by halving and quartering it, by using multiples of its length (2 x, 3 x, and 4 x the length), or by shortening or lengthening it an equal amount each time and recording the number of swings per minute.
c. Graphs will vary. However, your graph should show that when the string is full length, the time for 5 swings is less. The longer the string is, the longer it takes to go back and forth.
2. a. The connected points need to pass through the origin (0,0) to show that there is no swing (no time taken; the period is 0) when the rope on the swing has no length.
b. Your graph should be a curve because the relationship between time taken for 5 swings and rope length is not a straight line. (For example, the time for the half length is not half the time for the full length and the same would apply to any points in between.)
c. Estimates will vary, but the time for 5 swings for twice the full length should be more than double. (Imagine the curve on your graph as it gets steeper – where might it end up for twice the full length?)