This is a level 2 algebra strand activity from the Figure It Out series.
A PDF of the student activity is included.
Click on the image to enlarge it. Click again to close. Download PDF (265 KB)
continue a sequential pattern
show a pattern on a graph
counters
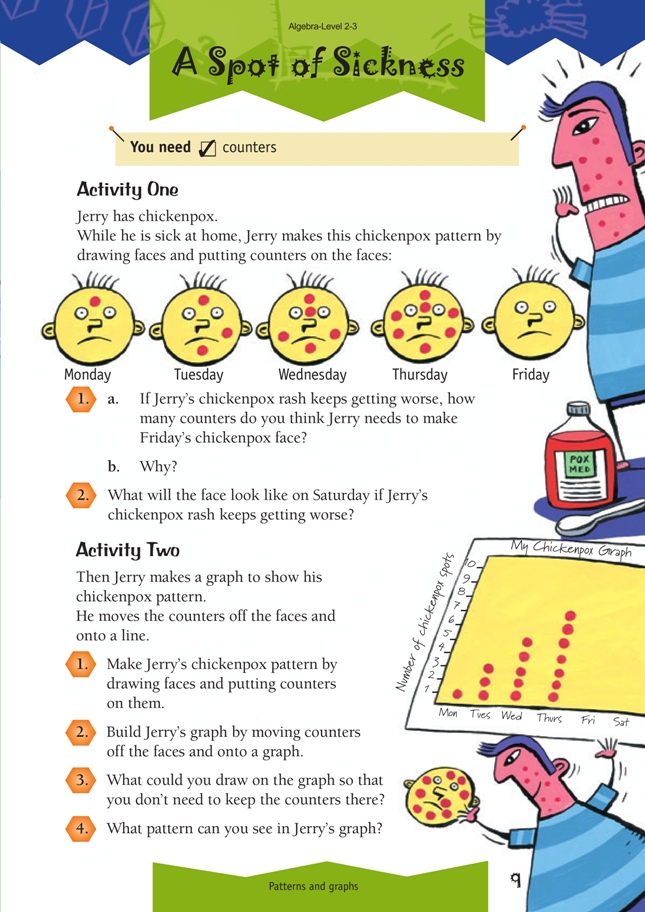
Activity One
Counters and faces drawn on pieces of card are essential for this activity. They enable students to construct the graph in Activity Two.
Students will need to count the number of chickenpox spots carefully as any errors will obscure the pattern. Organising the information in a table is helpful.
The number pattern makes it clear that the number of chickenpox spots is growing by two each day. Other answers are possible as long as they can be justified. For example: “I think Jerry has six chickenpox spots on Friday because he is getting better, and he loses the first chickenpox spot he got.”
Activity Two
This activity requires students to draw a graph of the relationship between the days of the week and the number of chickenpox spots on Jerry’s face. It is conventional to show such relations as points on a number plane, as in the example below. This means that a point at the top of each column of counters is sufficient. It is also conventional to have the independent variable (the one we have knowledge of) on the horizontal axis and the dependent variable (the one we are trying to find out about) on the vertical axis.
In this activity, students’ graphs will vary, but encourage them to explain their graphs to others to facilitate peer assessment. It is vital that students explain the position of points to establish whether or not they understand ordered pairs.
Answers to Activities
Activity One
1. a. 9
b. Each time, Jerry adds two more spots.
2. It will have 11 spots on it.
Activity Two
1. Answers will vary.
2. My Chickenpox Graph
.gif)
3. Answers will vary. One idea is to mark dots on the paper where the counters were.
4. Two extra spots each day make a diagonal pattern.