This is a level 4 statistics activity from the Figure It Out series.
A PDF of the student activity is included.
Click on the image to enlarge it. Click again to close. Download PDF (1086 KB)
create a dot plot
evaluate statements made abotu data
conduct an investigation
makea conclusion from the data
This diagram shows the areas of Statistics involved in this activity.
![]()
The bottom half of the diagram represents the 5 stages of the PPDAC (Problem, Plan, Data, Analysis, Conclusion) statistics investigation cycle.
Statistical Ideas
Spin Doctor involves the following statistical ideas: using the PPDAC cycle, evaluating statements made by others, and using investigative questions, multivariate data sets, and dot plots.
FIO, Levels 4 -4+, Statistics in the Media, Spin Doctor, pages 16-17
A classmate
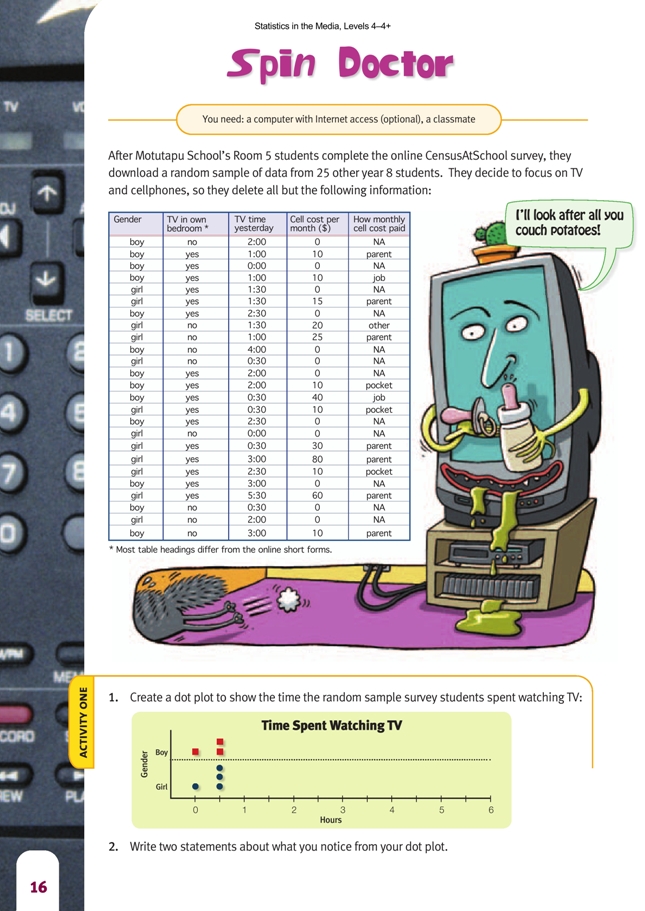
Activity One
In this activity, students are asked to reorganise the data into a dot plot in order to “paint a picture” of the situation. Graphs can highlight the features of a data set more easily than looking at data in a table. Encourage your students to look at the whole shape of the graph (that is, the whole distribution) rather than just at the highest points.
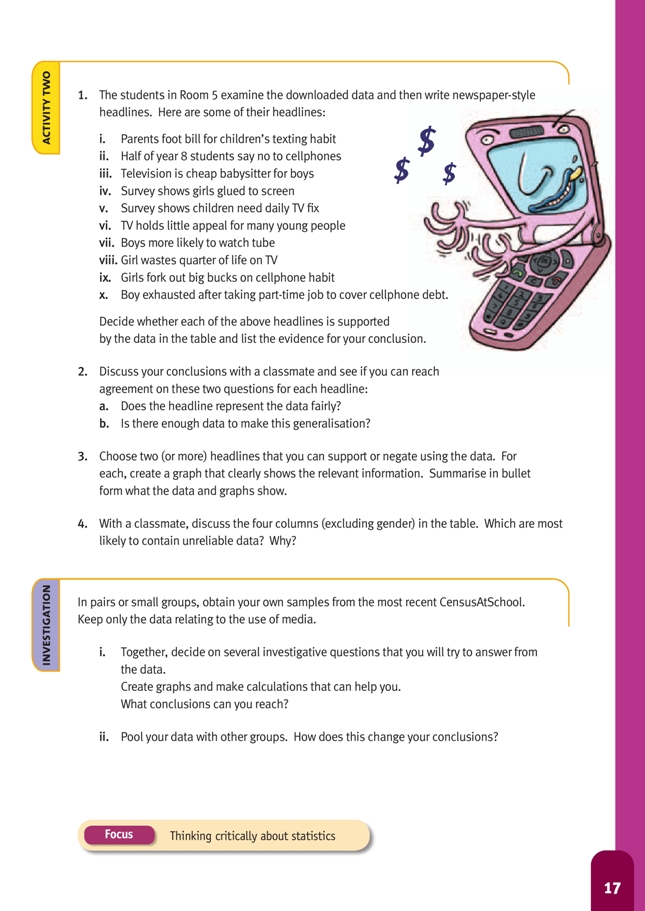
Activity Two
The purpose of this activity is to highlight some of the ways that the media can skew data for their own purposes. Students may be unaware that newspaper or magazine headlines can be inflammatory, taking only the parts of the data that back up their argument. Usually this data is not untrue – but sometimes it doesn’t tell the whole story. Encourage your students to always ask questions of the statistics presented to them. For example, in media reports, they should want to know how the data was obtained and what else the data may show. Sometimes, the same data can be used to support contradictory statements. Encourage your students to fi nd examples of these in the students’ headlines in this activity (for example, “Survey shows girls glued to
screen” and “Boys more likely to watch tube”).
It may be useful to have students answer the following questions themselves before beginning the task:
• Do you have a TV in your bedroom?
• How much time did you spend watching TV yesterday?
• About how much do you spend on your cellphone each month?
• How do you pay for your cellphone usage (parent, job, pocket money, other)?
This may give them more understanding of the situation and help answer questions such as that in question 4 regarding unreliable data. As a follow-up activity, the students could compare their own class’s responses with the examples in the book and write headlines (funny or otherwise) to justify or refute them. Drawing another dot plot underneath the one they drew for question 1 in Activity One is a helpful way to compare two data sets. After they complete question 3, have the students share their graphs with a classmate and discuss whether the graph is effective in communicating the desired information.
Investigation
Before your students begin their investigations, you may need to revise the PPDAC cycle with them. The main purpose of Spin Doctor is to encourage students to explore the CensusAtSchool website. You may need to allow the students time to try out some of the different aspects of this site, such as the random sampler,
building summary tables, and the data viewer.
Note that although the 2008 CensusAtSchool questionnaire contained media-use questions, this may not be true for subsequent years.
After the students take a random sample of responses, remind them to keep the identifying data (such as age, gender, year, and region) and the questions relating to media and to delete the data for all the other questions.
The survey section of CensusAtSchool lists the questions asked. Encourage the students to explore this section, especially the media questions, because it will help them to interpret the data they download from CensusAtSchool. (As noted in the students’ book, most of the headings in the table on page 16 differ from the short forms used on the CensusAtSchool website. They make sense on the website, where additional information is provided via the questionnaires, but fuller versions are needed for clarity in the students’ text.)
Problem
The students need to pose investigative questions. Using the starter “I wonder …” is useful. Questions can be of the following types: summary, comparison, or relationship. Examples of these in relation to the CensusAtSchool database for 2007 are:
Summary:
• I wonder what TV shows typically appealed to year 7 students in 2007?
• I wonder what websites year 9 students typically liked to access in 2007?
• I wonder what amounts girls in 2007 typically spent on cellphones each month?
Comparison:
• I wonder if year 8 girls tended to send more text messages than year 8 boys?
• I wonder if more younger students tended to get the money from their parents for their cellphone bills than older students?
• I wonder if students in high school in 2007 sent more text messages than intermediate school students?
• I wonder if students in years 9 and 10 in 2007 sent more text messages than those in years 11 and 12?
Relationship:
• I wonder if there is a relationship between the age of the student and the amount they spend on their cellphone?
• I wonder if students who have an MP3 player are more likely to have their own cellphone as well? (The students could probably use a two-way table [as in the notes for pages 22–23] to answer this.)
• I wonder if there is a relationship between the amount of money students spent on cellphones and the number of text messages they sent?
• I wonder if there is a relationship between the number of text messages that the students sent and the number of text messages they received?
Plan
Have the students look at the CensusAtSchool survey questions to help them pose investigative questions. Remind them that investigative questions are questions we ask of the data; survey questions are questions we ask to get the data. Note that region and year level happen by default, so the students should keep these two variables.
Data
The data can be downloaded from the CensusAtSchool database www.censusatschool.org.nz
Analysis
The students will draw a variety of graphs depending on the data they have selected. They should be writing “I notice …” descriptive statements about the shape of the data, the centre of the data, the spread of the data, and any appropriate statistics that may have been calculated.
Conclusion
The students should be answering the investigative question(s) they posed and using evidence from the analysis to support their answers.
Spin Doctor uses a small sample of 25 for practical reasons. Encourage your students to think about the advantages and disadvantages of larger sample sizes.
One of the main advantages of using the data obtained from CensusAtSchool is that it is a large database and students are therefore not limited by the time constraints involved in collecting a large amount of data themselves.
Answers to Activities
Activity One
1.
.gif)
2. Statements will vary. For example:
• Most students watch between 30 minutes and 3 hours of TV per day.
• One girl watches a lot more TV than most other students.
• The time data is spread from 0 hours to 5 hours.
• The spread for girls’ and boys’ TV watching times is similar.
Activity Two
1. Most of the headline statements have some basis in the data, but some of the interpretations are based more on opinion than fact.
i. Parents are cited as paying for cellphone costs more often than any other category (7 for parents, 3 for pocket money, 2 for job).
ii. Almost half the group (12/25) spent no money on cellphones (presumably because they didn’t have one).
iii. The boys seem to watch TV more than the girls; 9 out of the 13 boys in the group have a TV in their bedroom (but only 6 out of the 12 girls).
iv. 8 of the 12 girls watched 1 hour or more of TV yesterday. However, the headline ignores the fact that 10 out of 13 boys also watched TV for 1 hour or more.
v. Only 2 students didn’t watch TV on the day recorded, and one of these was a boy with a TV in his bedroom.
vi. The data does not support this statement – see v above.
vii. The mean time watching TV is greater for the boys than for the girls, but the difference is small. (The mean time for boys is 1.85 hours, and for girls it is 1.67
hours.)
viii. 1 girl watched 5.5 hours of TV over 24 hours (but this is only 1 day – perhaps she was sick in bed).
ix. 8 out of the 12 girls and 5 out of the 13 boys have a cellphone. Five of the 8 girls spend $20 or more per month on their cellphone. The mean spending for the
girls with cellphones is $31.25 and for all the girls, $20.83; for the boys with cellphones, the mean is $16, and for all the boys, it is $6.15.
x. One boy had $40 of cellphone spending and a parttime job to pay for it. (Whether he is “exhausted” would depend on what the part-time job is!)
2. a.–b. Discussion will vary. The headlines often put an “emotional spin” on the data and don’t incorporate all the information, so they can be misleading. There is not enough information given to justify any of the generalisations made (even for ii, as those without cellphones might wish they had them!).
3. Answers will vary. Following are some examples: For “Parents foot bill for children’s text habit”:
Conclusions:
• Of the 13 students who spent money on cellphones, 7 of these had the bill paid by their parents. This is just over half of the students with cellphones.
For “Survey shows children need daily TV fix”:
• 67% of the girls (8 out of 12) watched at least 1 hour of TV yesterday.
• 77% of the boys (10 out of 13) watched at least 1 hour of TV yesterday.
• 92% of the students (23 out of 25) watched some TV yesterday.
• Only 2 students watched no TV at all yesterday. For “Girls fork out big bucks on cellphone habit”:
• More boys than girls don’t have a cellphone.
• The girls’ mean monthly cellphone spend is $20.83 compared with that for the boys of $6.15. The mean spend for the boys who have a cellphone is $16, and the mean spend for the girls who have a cellphone is $31.15.
• The mean spend ($32.86) for students whose parents pay the cellphone bill is higher than the mean spend for any of the other options.
4. Any of the data may be unreliable. Students may not tell the truth as to whether they have a TV in their bedroom, and they may not want to admit how much
time they spend watching TV. Cellphone costs could vary greatly from month to month. If a parent is paying for the cellphone bill, students may not be fully aware
of how much it costs each week. Students could only select one option for where their money came from. If it comes from more than one source, they’ve had to
select just one.
Investigation
i. Practical activity. Results will vary depending on the data selected. Ask your teacher if you can look at the suggestions given in the Teachers’ Notes for possible investigative questions using 2007 data.
They include:
• I wonder what amounts girls typically spent on cellphones each month?
ii. The more data collected, the more accurate the conclusions are.
Key Competencies
Spin Doctor can be used to develop these key competencies:
• thinking: discerning if answers are reasonable and designing investigations
• using language, symbols, and texts: demonstrating statistical literacy, and communicating fi ndings
• managing self: planning
• relating to others: working co-operatively in groups
• participating and contributing: sharing equipment and resources.