This is a level 4 activity from the Figure It Out series.
A PDF of the student activity is included.
Click on the image to enlarge it. Click again to close. Download PDF (6358 KB)
Statistical literacy is the ability to read and interpret data. Statistics provides the means to organise large amounts of data in such a way that it communicates meaning. However, by presenting statistical information in a simplified form, it is also possible to manipulate or misinterpret it.
Statistical information is seen as adding weight to a discussion because it is thought to be scientific. People often accept statistics without asking how data has been gathered or whether crucial information has been left out. Students need to be able to intelligently evaluate and interpret the statistical information they will encounter in everyday life.
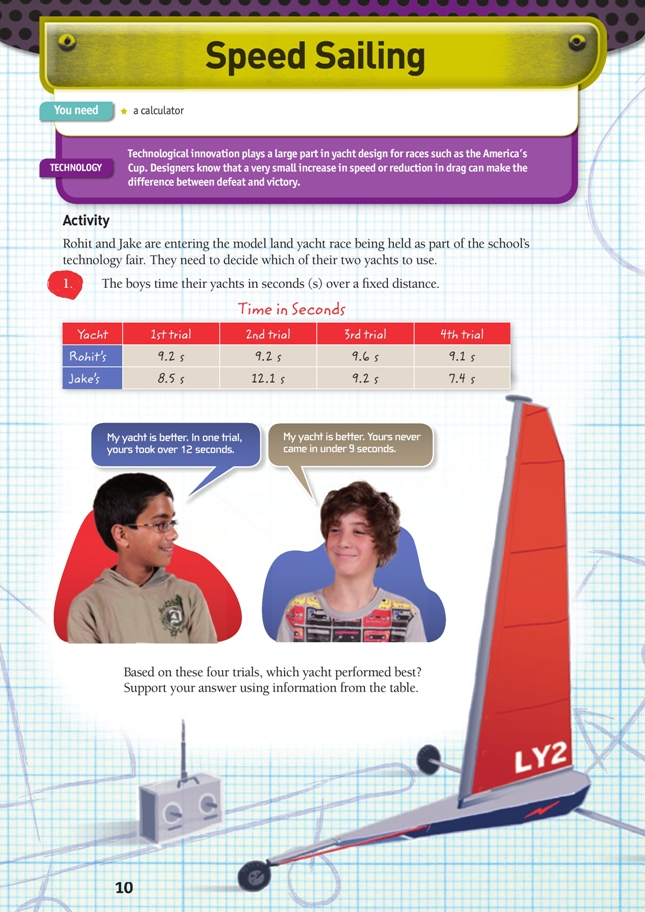
In these activities, students interpret data in order to compare the performance of two model land yachts.
FIO, Technology in Practice, Levels 3+-4+, Speed Sailing, pages 10 - 11
The word “average” is often used informally to identify something as typical or ordinary. In mathematics, an average is a single value that is used to represent or summarise a set of data. There are three types of average: median, mean, and mode. Of these, median and mean are generally much more useful than mode. The median and mean are called “measures of central tendency” because data tends to cluster around these values.
Students often become preoccupied with calculating the mean and fail to think about the information it provides. Emphasise the idea of “centre” in data. The median is literally the mid-point. The mean will usually be close to the median, but it can be unduly influenced by very large or small values. One way of understanding the mean is to imagine a dot plot as a seesaw, with the dots being people. Where would the fulcrum have to be placed if the seesaw were to balance? That point is the mean.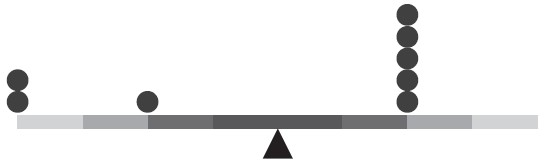
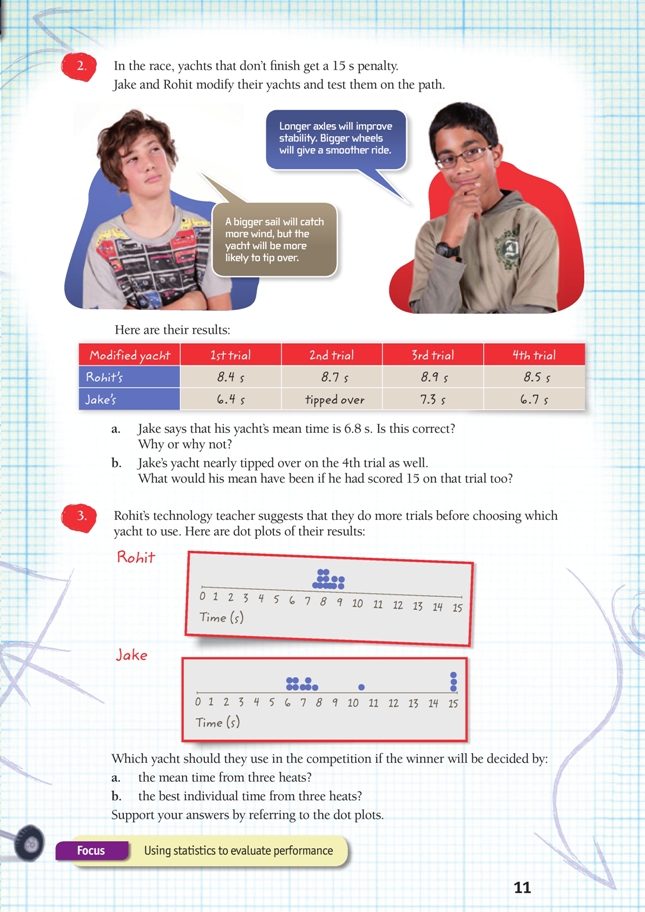
Variation occurs in all situations and variability in performance is expected. Averages are useful for comparing data sets, but spread of data is also important. If data is very spread out, the mean is less representative than if data values are close together. A large spread makes it harder to predict the outcome of a trial. If the boys had limited their investigation of the modified yachts to four trials, it would be difficult to decide whether Jake’s 15 was an unlucky trial or whether his yacht is less reliable than Rohit’s. By conducting further trials, a pattern is revealed: Jake’s yacht tends to travel faster than Rohit’s, but it is an inconsistent performer.
Students need to consider how the two yachts will be judged before deciding which yacht should be used in the competition. Use this to discuss the importance of looking at both central tendency and spread when analysing data.
Interpreting visual representations such as diagrams develops the key competency using language, symbols, and texts.
Technology-related student activities
- Research design failures in America’s Cup races, for example, oneAustralia AUS-35 in 1995.
- Conduct an inter-school technology challenge (see www.techlink.org.nz/teaching-snapshot/Y07-10-Middle/Inter-school-Technology-Challenge.htm for ideas).
Exploring the technology-related context
Designers of high-performance racing yachts know that even a small competitive advantage can lead to success. For events such as the America’s Cup, designers often take risks to achieve this advantage, sometimes compromising the structural integrity of the yachts. In recent competitions, this has resulted in dramatic failures of masts, sails, and hulls.
Answers to activity
1. Answers will vary. Here are two possible conclusions:
- Rohit’s yacht performed best: It performed more reliably than Jake’s. Rohit’s poorest result was 9.1 s, while one of Jake’s trials was over 12 s.
- Jake’s yacht performed best: Rohit’s best time was more than 9 s. Jake’s best time was 7.4 s.
2. a. Jake has not included the 15 s penalty for the boat tipping over. This is misleading. If the 15 is included, his mean result is 8.85 s. [(6.4 + 15 + 7.3 + 6.7) ÷ 4]
b. (6.4. + 15 + 7.3 + 15) ÷ 4 = 10.925 s.
3. a. Rohit’s yacht. Although Rohit’s yacht tends to sail more slowly than Jake’s, it is more stable and, therefore, more reliable. In the trials, Jake’s yacht tipped over 3 times out of 12 trials. One of his trials was over 10 s.
b. Jake’s yacht. Although Jake’s yacht is less reliable, it usually travels faster than Rohit’s yacht. Its best time was close to 6 s; Rohit’s yacht’s fastest time was more than 7 s.