This is a level (3+ to 4+) mathematics in science contexts activity from the Figure It Out series.
A PDF of the student activity is included.

Click on the image to enlarge it. Click again to close. Download PDF (1421 KB)
Students will:
- collect and display times-series data
- use a scale to read temperature in degrees Celsius
- interpret time-series graphs and use them for reasoned predictions
- draw a trendline (line of best fit).
Students should discover that:
- graphs are an important means of showing relationships and trends
- the shape of a graph is based on the real-world data it depicts.
a sunny day
corks, plugs, or duct tape
a timer or watch
classmates
a bucket of water
a funnel
5 equal lengths of dark hose
FIO, Using Resources, Levels 3+-4+, Solar Shower Power, pages 8 - 9
Preparation and points to note
This activity requires a sunny day. If more than one group is involved, you will need multiple sets of
materials.
Tables and graphs are ways of representing information and ideas and, as such, are part of the key competency using language, symbols, and texts that can be applied to this activity.
The results of the investigation will be influenced by the conditions at the time, for example, cloud obscuring the Sun for a time or an occasional cool breeze. For this reason, the students should keep a record of any changes in conditions and take account of this information when evaluating their results and comparing their findings with those of other groups. Before they begin, they should plan how they will record and organise their data. If possible, the data should be transferred to a computer spreadsheet program.
Additional resources are likely to be needed for the second part of the experiment; these should be the students’ responsibility, so they will need to plan ahead.
Be aware that although the water won’t get to boiling point, it may get very hot. Solar shower manufacturers warn that water can reach 70º in a couple of hours.
Points of entry: Mathematics
The initial phase of this activity involves students in gathering measurement data. Make sure that your
students are able to read the scale, including any gradations between the numbered units. They will need to be as quick and as accurate as possible when taking measurements.
Question 2 asks them to create a graph of their data. This should be a time-series graph, something like the one on page 8 of the students’ book. If the students have entered their data into a spreadsheet, they can create the graph using the computer. As long as the measurements have been done well and there have been no changes in the conditions, the graph should be a smooth curve, not a straight line. It is important that the students “read” the story their graph is telling them and, if it looks erratic, that they explain the likely causes.
Question 2d asks the students to predict what would happen if they continued to take measurements for a full 3 hours. Check their graphs to make sure that they realise the water won’t get hotter and hotter indefinitely. Ask them to try and explain why it won’t.
Question 3 involves making a change and seeing what the impact of this change is on the rate of heating and the temperature of the water in the hoses. If the students enter their data for this second experiment into the spreadsheet used for question 2, they will be able to graph both sets of data (series) on the same axes and easily compare them. The important thing is to relate the effect of the experimental change to the shape of the graph. For example, the use of reflective material should increase the slope of the graph and may give it a higher maximum.
Points of entry: Science
Discuss how the properties of different materials conduct, radiate, and reflect heat or insulate against temperature change. Ask How do the colour and transparency (of the hose material) influence heat absorption? Have them investigate how radiant heat travels through the vacuum of space to Earth and the different ways in which heat energy is transferred (conduction, radiation, convection).
Reinforce the importance of method and the risk of experimental error. There are numerous potential sources of error that may invalidate conclusions or make them harder to reach. For example, unequal quantities of water in the hoses, thermometers left in sunlight, hoses entering shade as the Sun moves across the sky, clouds obscuring the Sun, some hoses getting more or less than their 10 minutes due to slowness or carelessness. The second experiment will necessarily take place at a different time of day and/or under slightly different conditions. The students should try to control the experiment and account for changing conditions as best they can.
Encourage the students to think about why the investigation has been set up with 5 equal lengths of hose. Ask What would be different if you were to keep taking temperature readings from a single length?
When the students compare notes, they should find that some practices are much more effective than others, for example, using narrow diameter black hose in a box lined with reflective material and covered with a wellsealed glass lid. Although each student group tested only 1 idea, for question 4 they can combine changes to get the most effective solar shower. The students’ designs for a solar shower should incorporate ideas that have been shown to improve heat gain. The estimates in question 4 will necessarily be speculative, but they should be grounded in the experimental data that the students have available. They may be interested in making a prototype of their solar showers. This could become a joint mathematics, science, and technology project.
Answers
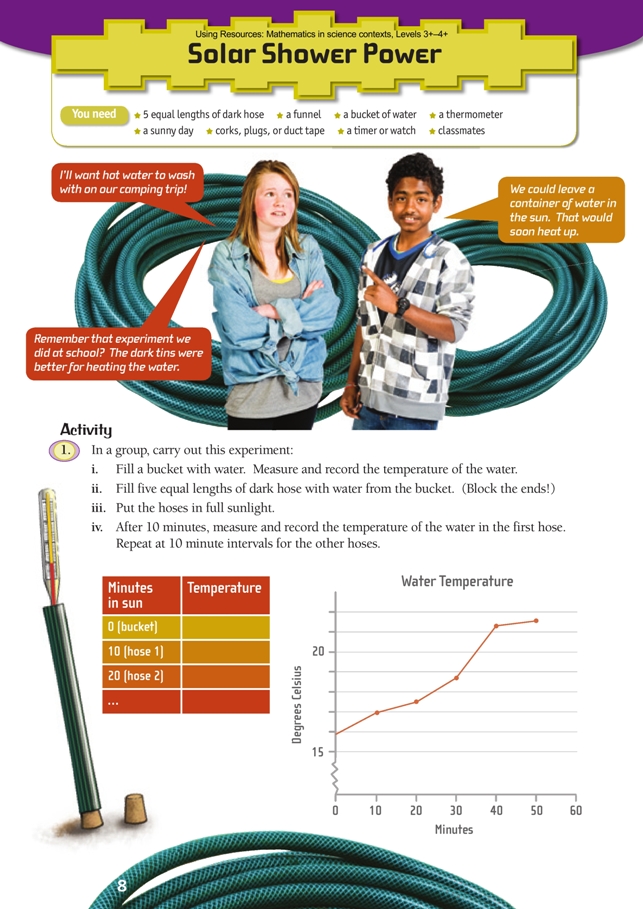
1. i.–iv. Practical activity
2. a. Results will vary, but your graph should show the temperature of the water increasing over time.
b. Find 2 points on the graph that are 5º apart and then find the time difference between them. For example, if the temperature was 17º at 10 minutes and 22º halfway between 20 and 30 minutes, it probably takes about 15 minutes to increase by 5º. If possible, use several sets of points on the graph to find a consistent or average time interval because the rate of increase is likely to change as the water gets warmer.
c. Extend the trend to 60 minutes to estimate the temperature after an hour in sunlight. For example, draw a trendline through the middle of your points in the direction that the graph is heading and see what temperature it crosses at 60 minutes on the time axis:
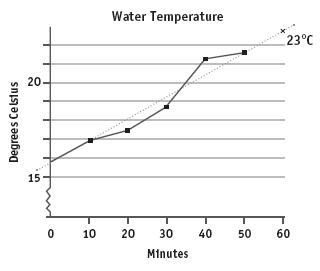
d. The line on your temperature graph should flatten out to look something like this over 3 hours:

No matter how long the hose is left in sunlight, the water is not going to get anywhere near boiling point (100º). Eventually, the increase will stop and the water will start radiating heat.
3. Ideas for heating the water faster might include: using smaller or larger hoses, putting the hoses on concrete, putting the hoses on a mirror or reflective foil, putting the hoses in an open box (or one covered with glass) with reflective or insulated sides, putting the hoses together or spreading them out, coiling the hoses, using hoses of a different colour.
a.–b. Practical activity. Results will vary.
c. Use your evidence to determine which ideas worked better than others and how these ideas might be incorporated into your shower design.
4. a. Sketches will vary; make sure you label the ideas you include.
b. Estimates will vary, but they should be based on your earlier experiments.
c. Your maximum temperature should probably be hotter than that obtained in your experiment. Solar showers sold in stores can heat water to about 70º on a 25º day. In fact, the water can get so hot that it scalds, but it won’t get to boiling point (100º).
d. Your graph should be similar to the graph of your experimental data, but as you are combining your best ideas, hopefully you should expect an even better outcome. This will be reflected in a graph that ends at a higher point.
5. Practical activity