This is a level 4 statistics activity from the Figure It Out series.
Click on the image to enlarge it. Click again to close. Download PDF (154 KB)
write a survey
plan how to record data
plan how to describe data
plan how to display data
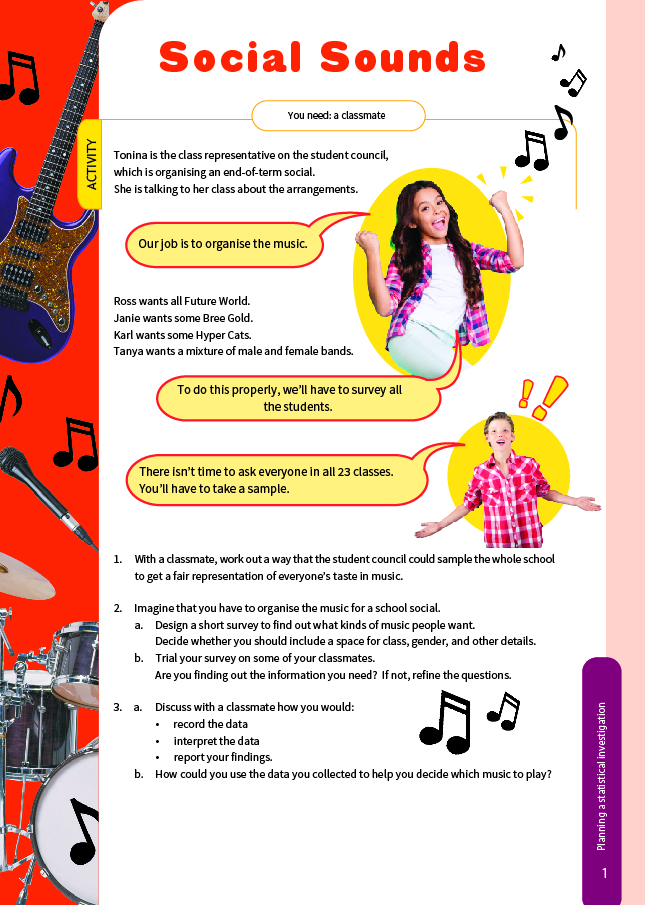
FIO, Level 4+, Statistics, Book Two, Social Sounds, page 1
A classmate
This activity introduces students to the issues that arise with any statistical survey. They are likely to get the greatest benefit if there are other groups doing the same task at the same time. The different approaches, pitfalls, and conclusions could become the subject of a report-back and debriefing at the end. As the teacher, you have plenty of scope for varying this task to suit the needs of your students.
The important concepts are described in the following paragraphs. Introduce these to the students as the need arises. They should become familiar with all these words, and by the time they conclude the activity, they should have developed some understanding of what each of them means in a statistical context.
The population is the entire group that is of interest (for example, every student in Brown River Primary School). A survey is a questionnaire that is used to gather data from a sample of the population. A census is the alternative to sampling; it involves collecting data from the entire population.
When sampling, representativeness is critical if the data collected and the decisions made are to prove reliable. To be representative, a sample needs to match the population on factors such as gender and ethnicity. A sample that is not representative is said to be biased.
For a sample to be genuinely without bias, every member of the population should have the same chance of being selected. This means that the person making the selection must use a method that, once in place, picks the names for them. For example, students doing this activity could select, say, every fifth name on the school roll. Alternatively, they could use random numbers (found from a calculator, computer, or telephone directory).
It is worth emphasising that people (adults as well as children) are not capable of making a genuinely random selection of names or numbers simply by choosing one that comes to mind and then another. There are always biases in a selection made this way, even if they are hidden.
Answers to Activity
1. Answers will vary. Possible methods include selecting, for example, every fifth person from the school roll; numbering all the students on the school roll and using random numbers from a calculator to select a sample; or, for each class, drawing the names of two boys and two girls from a hat. Methods must include a degree of randomness and be representative, that is, include people from all the levels and groups involved.
2. a. Surveys need to be confidential, use clear, specific, neutral language, have a brief introduction, and have a question that finds the type(s) of music that those surveyed prefer. The students surveyed should be able to ask for more than one type of music. (Just because they like one type doesn’t mean they dislike others.)
b. Practical activity. You could collate the data in a table, using tally marks.
3. a. The data should be collated and summarised in a table and could then be graphed. Because the data is discrete, a bar graph would be a suitable kind of graph. It will show the relative popularity of different kinds of bands and singers. You could report your findings to the whole class or the council, using tables and graphs.
b. Answers need to explain how the mixture of music will reflect the preferences of the students. The programme should have something for everyone while emphasising the kind of music preferred by the majority.