This is a level 3 activity from the Figure It Out series.
A PDF of the student activity is included.
Click on the image to enlarge it. Click again to close. Download PDF (142 KB)
Statistical enquiry is the process of exploring problems using an investigative cycle (PPDAC: problem, plan, data, analysis, conclusion; see www.censusatschool.org.nz). Much of the value of a statistical investigation is lost if the focus is only on data gathering and making graphs. In this activity, students are presented with the challenge of choosing two chair heights for the students in their class. To reach a conclusion, they need to gather data, sort it into groups, and make decisions about which chair height will best suit each group.
chairs
a metre ruler or a tape measure
FIO, Technology Rules!, Levels 2+-3+, Seat Heights, page 10
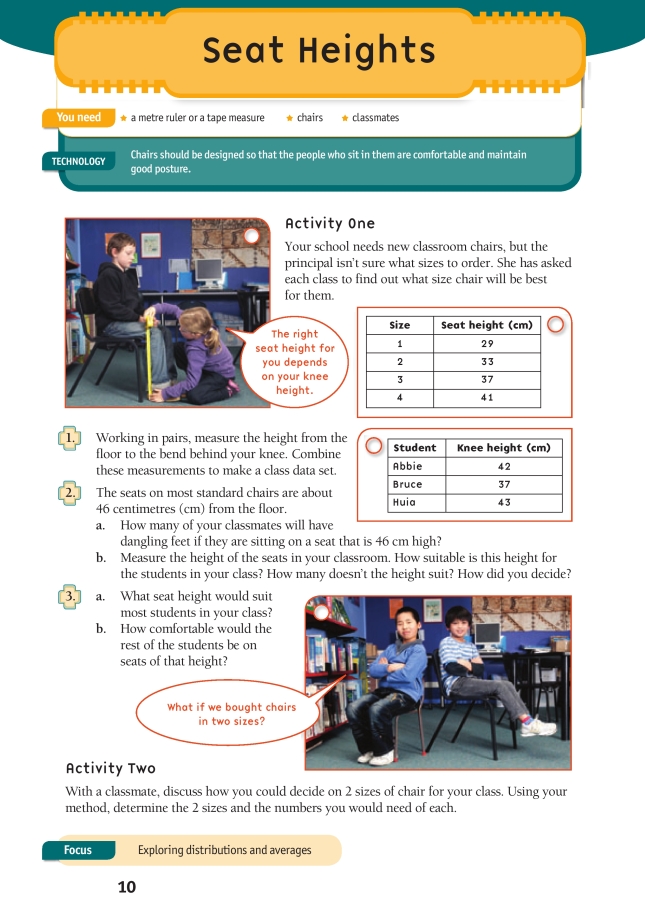
Activity One
requires students to measure the seat heights in their class and to gather information about the knee-to-floor heights of their classmates.
The concept of variation is central to statistical thinking. Variation occurs in all parts of everyday life: the amount of cereal in a bowl, the amount of time it takes to get to school, the weather. Most students will have an intuitive understanding of variation, for example, not all 10-year-olds are exactly the same height. It would be unusual if all the students had the same popliteal length.
Discuss the steps on the PPDAC poster (www.censusatschool.org.nz/resources/poster), relating each step to the context of choosing chair sizes for a class. For example, Problem (What does it mean for a chair to be “suitable”?), Plan (plan how to gather data [D]), Analysis (see whether the data can be divided into two groups), Conclusion (choose two heights or make other recommendations).
Students need to decide what it means for a chair height to be “suitable”. Is it better to have dangling feet or to be sitting on a chair that is too short? How much will students grow during a year? Are the conclusions likely to be different if data from another class is used instead or combined with existing class data? Is it realistic to have only two chair heights? 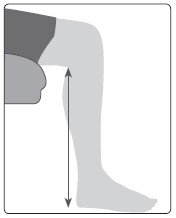
The technical name for knee height is popliteal length. CensusAtSchool provides information on how to measure popliteal length: www.censusatschool.org.nz/2009/documents/making-measures.doc
Ideally, the student will be seated with their legs bent at a right angle. This may present a problem if classroom chairs are too low or too high.
Check that students use the measurement equipment correctly, for example, measuring from zero and not the edge of the ruler. The ruler needs to be vertical. The popliteal lengths are likely to all be greater than 30 cm, which presents students with an additional challenge if they are using a 30 cm ruler. Discuss ways to address this.
It can be hard to see a pattern within a list of numbers, but when the same information is displayed as a dot plot, patterns are revealed. A dot plot shows how the data is grouped and whether there are any outliers.
The following graphs show the results of a random sample of 26 year 5 students using data from CensusAtSchool.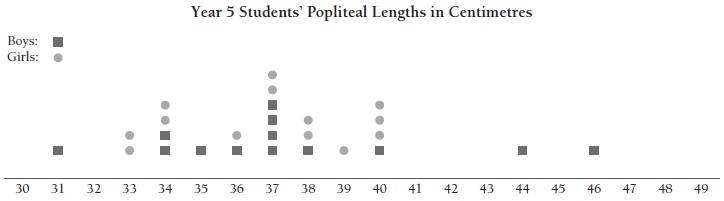
Discuss why “data detectives” need to look for clues that can be used to solve their investigative question. Encourage the students to look for patterns in the data they collect. Ask: Are there distinct groups? Are there any unusually large or small values? Is there a difference between the popliteal lengths of male and female students?
Classroom chairs come in a range of sizes. One manufacturer provides the following options:
| Years | Size | Seat height (mm) | Seat height (cm) |
| 1 & 2 | 1 | 290 | 29 |
| 3 & 4 | 2 | 330 | 33 |
| 5 & 6 | 3 | 370 | 37 |
| 7 & 8 | 4 | 410 | 41 |
The dot plot shows that size 3 (the chair height recommended for year 5 and 6 students) is a perfect match for six of the year 5 students. However, an exact match between popliteal length and chair height may not be necessary for its user to find the chair comfortable. The range of popliteal lengths that suit each chair height is a further investigation.
Ask your students to use the manufacturer’s information to identify how many of each chair size should be ordered for their class.
The class shown on the graph below clearly needs an assortment of chair sizes. If they decided that a seat 1 cm too high is acceptable, they would have one size 1 chair, seven size 2 chairs, twelve size 3 chairs, five size 4 chairs, and one standard chair.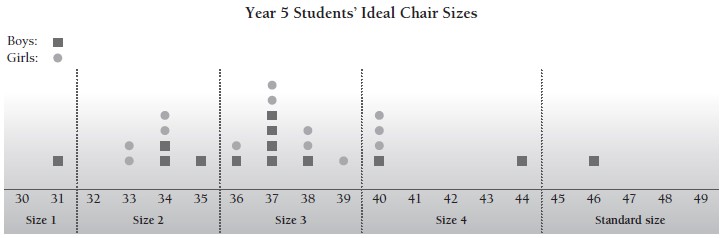
The manufacturer has chosen 37 cm as an appropriate height for a chair for year 5 and 6 students. Ask your class: How does this measurement relate to the data you have collected?
Discuss with the class what process the manufacturer may have used to determine the suggested chair height for each year level.
Discuss the practicality of providing chairs that meet the specific needs of every student in the class.
Using statistical information to make recommendations develops the key competency thinking.
Technology-related student activities
- Try out a variety of chairs or tables (for younger students, use the Goldilocks analogy) and comment on their comfort.
- Use the same chairs to try out different tasks – reading, painting, writing, eating a meal – and comment on their suitability.
- Interview older people about their experiences with technologies, their ease of use, and possible problems (for example, opening cans, climbing steps, using remote controls).
- A useful website for background information on ergonomics is http://casestudy-itgs.wikispaces.com/Social+Impacts+-+Ergonomic
Exploring the technology-related context
Ergonomically designed technologies ensure that people are not physically disadvantaged or endangered. Chairs should not cause backache or result in poor posture. Often, a product or environment may be suitable for one situation but not for another. For example, a classroom chair may not be suitable for watching a long movie.
Answers
Activity One
1. Practical activity. Answers will vary.
2. a. All those with a knee-to-floor height of less than 46 cm
b. Practical activity. Answers will vary.
3. a. The seat height that is equal to or just above or below the knee-to-floor measurement of most students in the class. (You could do a dot plot to see the range of measurements and then work out the best height for most students.) b. Some would have dangling feet, and some might be sitting on seats that are too low. Other aspects of comfort are beyond this measurement.
Activity Two
Methods will vary. For example, you might sort the class into a “short” group and a “tall” group and find a seat height that works for most of those in each group.