This is a level 3 and 4 statistics activity from the Figure It Out series.
A PDF of the student activity is included.
Click on the image to enlarge it. Click again to close. Download PDF (1393 KB)
answer questions forma time-series graph
interpret statements about the data
make conclusions based on graphs
conduct a survey
construct a time series graph
This diagram shows the areas of Statistics involved in this activity.
The bottom half of the diagram represents the 5 stages of the PPDAC (Problem, Plan, Data, Analysis, Conclusion) statistics investigation cycle.
A classmate
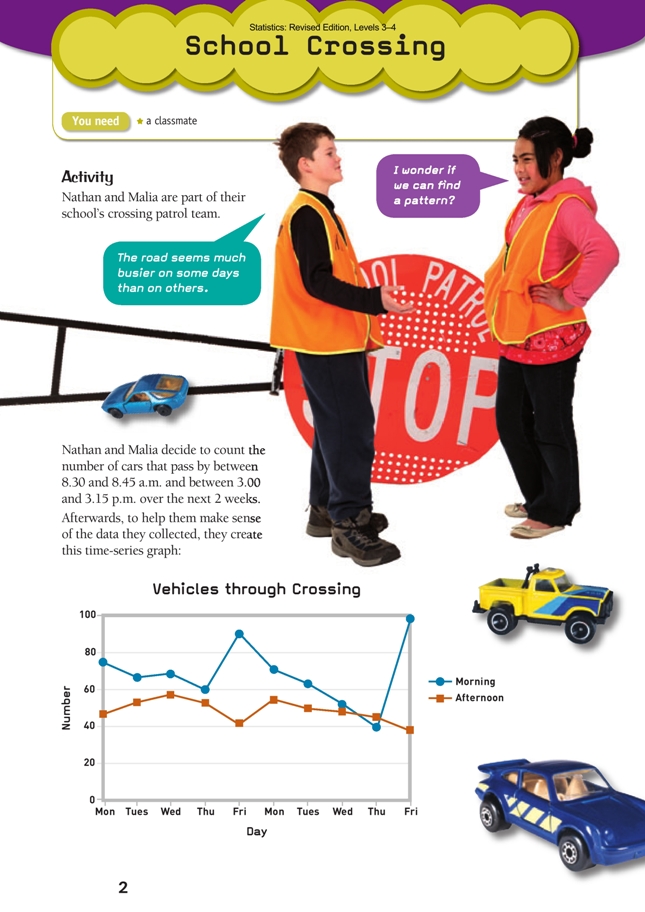
This activity requires the students to interpret a time-series graph* and assess the validity of statements made about it.
The graph shows discrete numeric data in two series (number of vehicles in the morning and in the afternoon). Although time (horizontal axis) is a continuous variable, the data has been grouped by day, and so the time data is effectively treated as discrete.
As they work through the different statements, the students will:
• make comparisons between traffic flows on different days
• make comparisons between traffic flows in the morning and the afternoon
• make generalisations, based on the limited data available.
As an orientation, have the students look quickly at the graph and briefl y describe a few obvious features.
Like a number of the other activities in this book, question 1 is designed to give students models of the kinds of statements they can make when looking at graphs. It is also designed to make them search for data that will either support or refute the statements and, if necessary, use data to resolve disagreements.
Question 2 is designed to have students look for other data-supported patterns.
Question 3 asks students to think about the human factors that may be behind two of the patterns that have been noted. Whatever explanations they come up with, these will be hypotheses. Challenge them to suggest how they might test these hypotheses.
Question 4 relates to the issue of variability. There are almost always fluctuations in data, even in carefully controlled situations. These fl uctuations may or may not be significant. In this case, some of the variation may be random. The only way to find out is to gather data for a longer period.
Investigation
Encourage the students to come up with a purpose for this investigation – a reason for going to the trouble (apart from that the activity told them to!). The purpose may be as simple as having fun investigating something of interest or as serious as investigating a safety concern.
You could ask:
• Who would be interested in the results of your survey?
• How would these results be useful?
Before the data gathering begins, ask the students to predict and write down what patterns they might find.
Answers to Activity
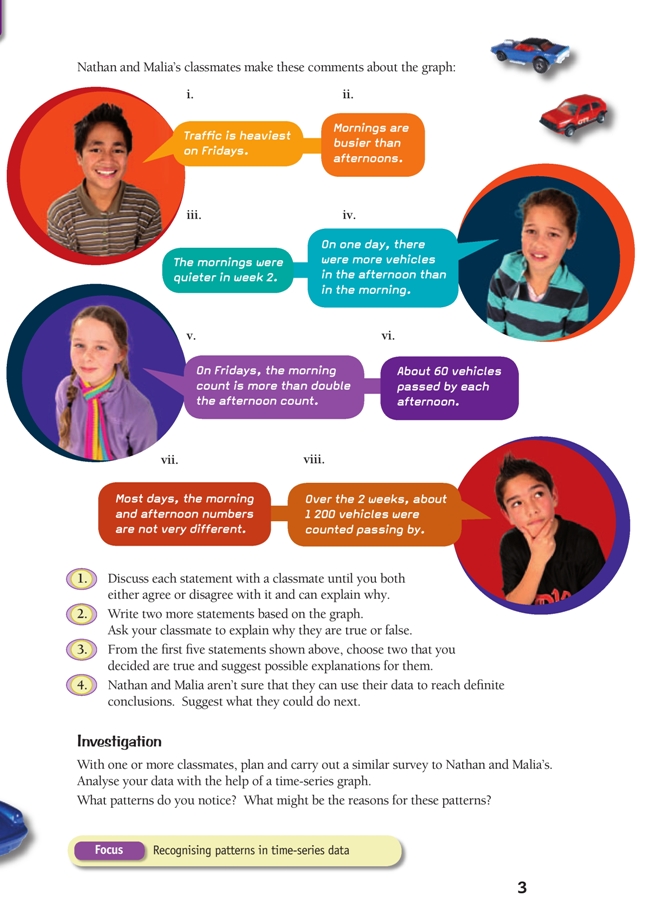
1. Discussion will vary, for example:
i. True for the mornings but not the afternoons (in fact, the two quietest
afternoons are the Fridays). True if you combine morning and afternoon data for
each day.
ii. True for every day except the second Thursday, so this is a reasonable
generalisation.
iii. True for every day except Friday
iv. True. The graph shows this was the case on the second Thursday.
v. True. The morning counts of approximately 90 (week 1) and 99
(week 2) are more than double the afternoon counts of approximately 41
and 39 respectively.
vi. False. The number never reached 60. It would be truer to say: “About 50 vehicles
went by on most afternoons.”
vii. You could argue true or false, depending on your defi nition of “not very different”. On 3 of the 10 days, the counts differed by less than 10. On another 4 days, the difference was less than 20.
viii. True. You can’t get an exact number from the graph, but the approximate figures
add up to about 1200.
2. Statements will vary. Possible statements include:
“The morning and afternoon counts on the Wednesdays and Thursdays are closer than the counts on other days.”
“The Friday afternoon count was similar both weeks.”
“The morning count is lowest on Thursdays, but the afternoon count is lowest on Fridays.”
3. Choices and explanations will vary. For example, for ii, it may be that most children get dropped off by their parents in the morning, but some catch a bus or a ride home with someone else in the afternoon. You also might want to think of possible reasons for the high morning and low afternoon Friday counts. Are more parents unavailable on Friday afternoons? (What happens on Fridays in your school?)
4. Suggestions will vary. Nathan and Malia have done a very good job of collecting data for two weeks, but patterns may be influenced by factors such as weather or major school activities such as sports days. The two classmates could continue collecting data over a longer time period (perhaps for another 2 or 3 weeks) and
see if the patterns they have found continue.
Investigation
Data, patterns, and explanations will vary.
Key Competencies
School Crossing can be used to develop these key competencies:
• thinking
• using language, symbols, and texts
• participating and contributing.