This is a level 4 measurement strand activity from the Figure It Out series.
A PDF of the student activity is included.
Click on the image to enlarge it. Click again to close. Download PDF (511 KB)
use simple scales to describe qualitative data
FIO, Level 4, Measurement, Book One, Scale of Events, pages 18-19
classmate
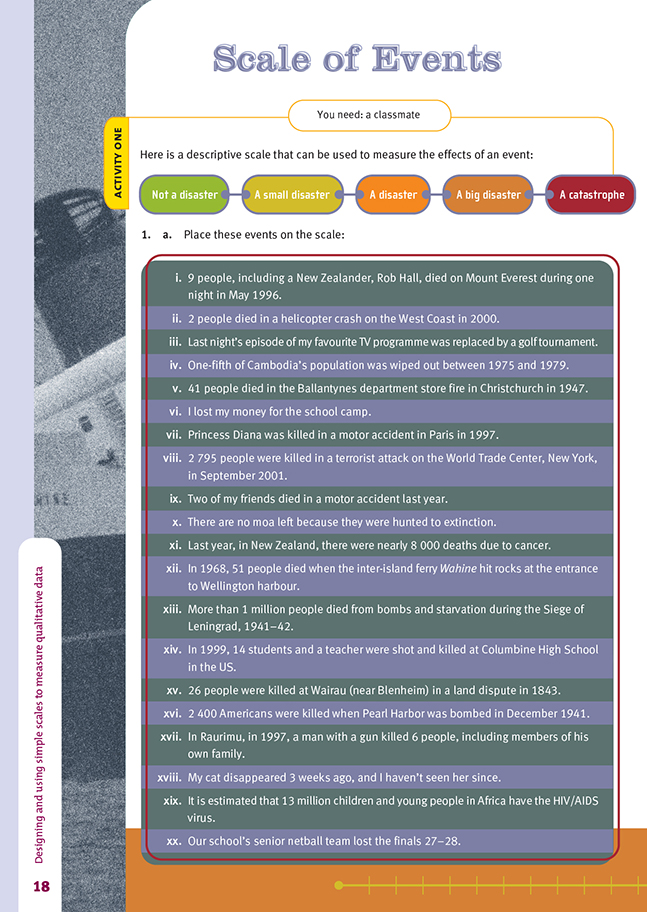
In this activity, the students are asked to place various events on a 5-point scale measuring their seriousness. The activity could be introduced with a discussion about what constitutes a disaster and what doesn’t, or the students could be given the chance to get right into the task and discover the issues for themselves, with
the class discussion coming later.
Whether we view an event as a disaster or not depends on a personal assessment that is itself based on a complex mix of factors including:
- our own values
- how the event impacted directly on our own lives
- where the event occurred
- the cause of the event
- how long ago the event occurred
- how many were killed or affected in the event
- who was involved
- how much we know about the event.
Students need to be accepting of the fact that others may view a particular event very differently for reasons that are valid for them.
Activity One and Activity Two both involve qualitative scales as distinct from quantitative scales. The notes for Energy Crises (page 1) explain the difference between these two kinds of scale. The students need to clearly understand the distinction.
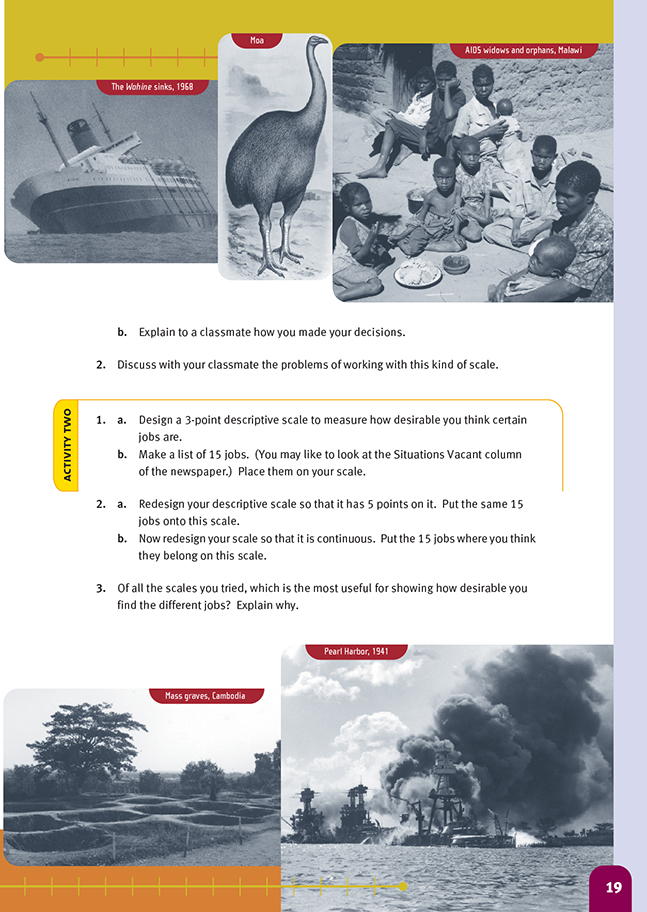
The questions in Activity Two ask the students to explore placing the same data set on different qualitative scales and then to evaluate the scales. Answers will vary, but they are likely to find that:
- the fewer the points on the scale, the quicker it is to categorise the data
- it takes longer to sort data on a continuum, but once this has been done, the scale reveals more.
Discipline Dilemmas (Statistics: Book One, Figure It Out, Years 7–8), explores the way in which the scale used can affect the conclusions drawn.
Cross-curricular links
Social Studies
This activity could be used as part of a unit on disasters.
Achievement Objectives
Demonstrate knowledge and understandings of:
- causes and effects of events that have shaped the lives of a group of people Time, Continuity, and Change, level 4)
- how and why people experience events in different ways (Time, Continuity, and Change, level 4)
Answers to Activities
Activity One
1. a. Answers will vary.
b. Explanations will vary. Factors you might take into account include:
- number of human deaths
- how recent the event was
- where the event occurred
- how it affects you personally.
2. Discussion may include these points:
- People rank the events according to their feelings, and feelings are not usually a very reliable guide as to importance.
- A large range of events may fall under the same label (descriptive category).
- Different people may not share the same idea of what is meant by each description.
Activity Two
1.–3. Results will vary.