This is a level 2 activity from the Figure It Out series.
A PDF of the student activity is included.

Click on the image to enlarge it. Click again to close. Download PDF (388 KB)
When using data to make comparisons, it is important to consider the validity of the data. The validity of the data depends on the purpose of the investigation: does the data measure what it is intended to measure? For example, when comparing samples of biscuits, finding the cost of individual biscuits would be valid if the investigative question is “Which biscuit is the cheapest?” If the investigative question is more complex, for example, “Which biscuit provides the best value for money?”, the data is only valid if it is used in conjunction with additional information such as biscuit size and taste. Particular care needs to be taken when working with qualitative (descriptive) data and personal preferences.
a calculator
apples
classmates
This activity explores ways that a qualitative variable such as taste can be analysed.
Discuss with the students why measuring taste is more complicated than measuring a person’s height. Ask Is it possible to have a unit for taste?
Taste is not completely subjective. Certain foods go well together – chocolate ice cream will have a wider appeal than onion ice cream. Food scientists investigate why some food combinations work and others don’t. For example, why might people find the thought of a tuna milkshake disgusting? Food producers alter the taste of their products to suit consumer preferences. Discuss with the students how food producers find out what those preferences are (decisions to alter the taste of a food product are based on statistical investigations).
Discuss the advantages and disadvantages of using rankings instead of ratings to compare the 4 samples. See the notes for A Changing World, pages 4–5, for more information.
Activity One
Discuss the steps of the PPDAC cycle and explain why each step is important when conducting statistical investigations. An important part of this activity is evaluating how well Mr Blake’s class made use of the cycle. Encourage the students to use this discussion when they apply the PPDAC cycle to their own investigation.
Activity Two
In this activity, students conduct their own food investigation, following the steps of the PPDAC cycle. Encourage your students to work collaboratively to decide how to gather data that can be used to make recommendations in question 2.
Comparing ideas about the relative impact of technological products develops the key competency participating and contributing.
Technology-related student activities
- The students list their personal preferences, giving reasons, for a product such as breakfast cereals, and compare.
- Show brands and/or logos to the class and ask the students to identify the product.
- The students examine package labelling and discuss what is presented and why.
- The students prepare to cater for an event such as a parents’ evening or a school production by devising recipes, or modifying existing ones, and testing the results. They request tasters’ feedback on taste, texture, consistency, and freshness. Hygiene and healthy options could be focal points.
- The students design a logo that is suitable for marketing one of their recipes.
Exploring the technology-related context
Commercial producers must comply with legal requirements as well as produce a desirable product. Public perception of a brand is also very important. Producers work for an optimum blend of regulatory compliance and consumer preferences, and they market accordingly.
Answers
Activity One
1. a. i. True. None of taster 4’s ratings were higher than 3.
ii. False. Nobody gave sample 3 a rating higher than 3.
b. Answers will vary. Taster 2 tended to give samples quite high ratings. Taster 4 tended to give lower ratings. Sample 1 was rated higher than the other 3 samples.
2. a.
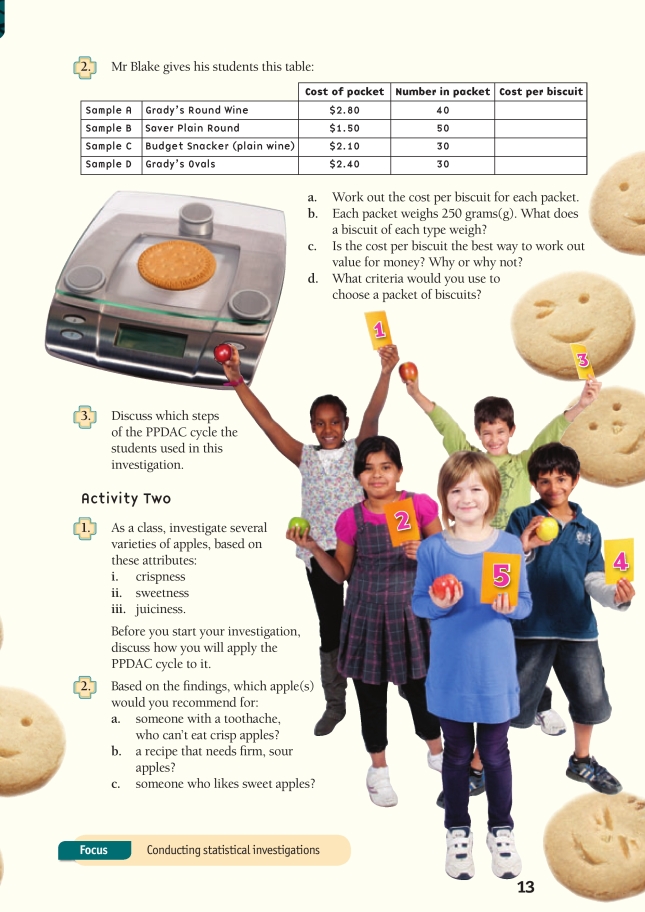
| Biscuit | Cost of packet | Number in packet | Cost per biscuit | |
| Sample 1 | Grady's Round Wine | $2.80 | 40 | 7c |
| Sample 2 | Saver Plain Round | $1.50 | 50 | 3c |
| Sample 3 | Crunchy Snacker (plain wine) | $2.10 | 30 | 7c |
| Sample 4 | Grady's Ovals | $2.40 | 30 | 8c |
b. Sample 1: 6.25 g
Sample 2: 5 g
Samples 3 and 4: 8.33 g
c. Answers will vary. Mass, taste, and texture also need to be considered. For example, samples 1 and 3 both cost 7c per biscuit. However, the taste test shows that people tend to prefer the taste of sample 1 biscuits. Sample 2 biscuits are the cheapest, but they also weigh less than the other biscuits because there are more biscuits in the packet.
d. Answers will vary. The number of biscuits in a packet could be important if you are catering for a large group or are on a tight budget, but people don’t want to eat biscuits that don’t taste nice.
3. The question that Mr Blake’s students are investigating is “Do biscuits that taste the best cost more?”
Problem: The investigative question that the students used was, “I wonder if the biscuits that taste best cost more?”
Plan: The students decided to use a taste test and also worked out the cost and the weight of each biscuit. They realised that the weight of the biscuits should be considered when looking at “cost”. For example, if biscuits from one sample are much heavier than biscuits from another sample, their cost per gram is smaller.
Data: 4 students taste-tested the biscuits, giving them a rating from 1 to 5. This gave Mr Blake’s class the data to make comparisons with. They also created a table showing the cost of individual biscuits.
Analyse: Patterns were found in the taste-test table. Sample 1 biscuits were rated the highest. The biscuits were analysed in terms of their individual cost and weight.
Conclusion: The investigative question was answered. Did you come up with any other ideas?
Activity Two
1.–2. Results and recommendations will vary.