This is a level 5 statistics activity from the Figure It Out series.
A PDF of the student activity is included.
Click on the image to enlarge it. Click again to close. Download PDF (698 KB)
calculate the probabilities of events occurring using fractions
FIO, Level 4+, Statistics, Book Two, Rough Justice, pages 18-19
A classmate
In this fantasy scenario, students work out the theoretical probability of each outcome. To do this, they should be learning to use fractions, including fractions of fractions and the addition of fractions. If you wish, however, you could adapt the activity so that the students use whole numbers, as suggested for the previous
activity (page 17 of the students’ book). In the adapted version, the students would visualise a lot of hapless victims making their choices over time and would keep a tally of their decisions.
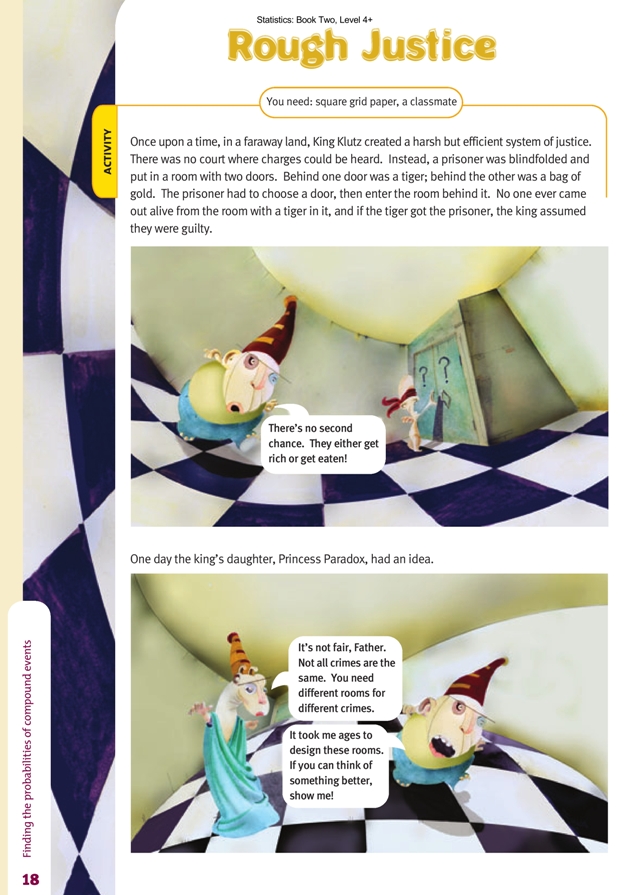
Given that the prisoners have no external clues on which to base their decisions, the alternatives are always considered equally likely. If 12 prisoners were to face the choices provided in layout ii, 6 could be expected to go straight to the tiger and the other 6 into the room with 2 doors. Of these 6, 3 could be expected to choose the next room with the tiger in it while 3 would go free with a bag of gold. So out of the 12 who started, we could expect 9 to get eaten while 3 would go free.
If you used this simplified approach, you could go on to encourage your students to think in terms of fractions: 1/2 would be condemned at the first door, and of the 1/2 who end up in the next room, 1/2 would be condemned while “1/2 of the 1/2” would go free. That is, 1/4 would go free while 1/2 + 1/4 = 3/4 would be condemned.
Tree diagrams are an alternative way of modelling the probabilities in this activity. See the Answers for these.
You will need to explain the rationale for multiplying the probabilities along each branch of the tree. If the probability of choosing a branch is 1/2 and the probability of choosing a branch off the first one is 1/3, the probability of choosing both branches is “1/3 of a 1/2” or 1/6 .
The experimental probabilities in this activity could be explored as a game, as suggested for Slater Mazes, this time using a dice to make the decisions. If there are 2 alternatives, the numbers 1–3 could indicate choice 1, and 4–6 could indicate choice 2. If there are 3 alternatives, assign 2 numbers to each of the 3 different choices. By collating their results with those of other students, they can quickly obtain a sizeable body of results. The students can then be encouraged to explain the reasons behind their results. In this way, they can make the link between experimental results and theoretical probability.
In question 2, students may design complicated room arrangements and then find that they are unable to determine the theoretical probabilities for them. If so, they may need to use experimental estimates of probability and go through the process as outlined for question 1.
Answers to Activities
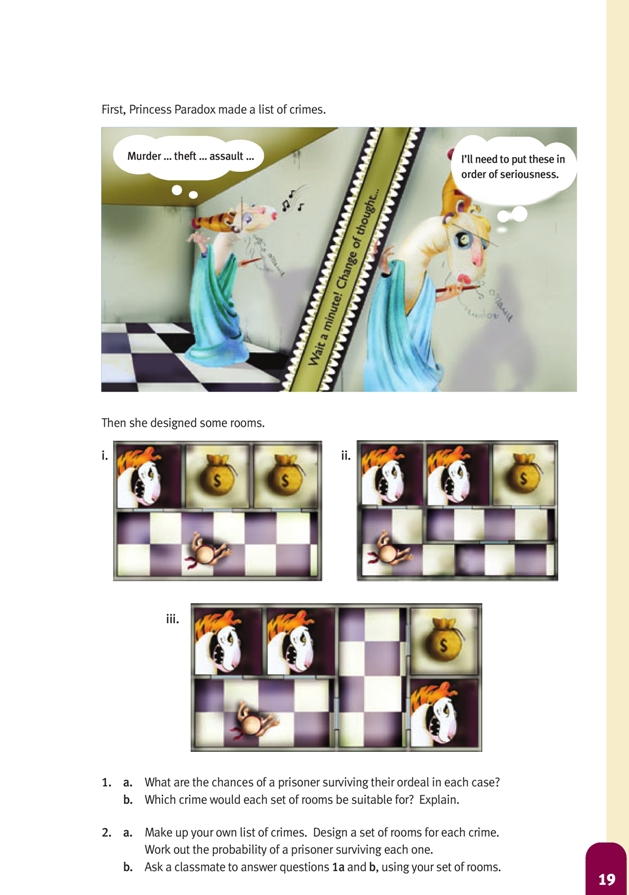
1. a. i. The probability of survival is 2/3 . (2 of the 3 doors lead to riches.)
ii. The probability of survival is 1/4 . (There is 1/2 a chance of choosing the first door safely, then 1/2 a chance of choosing the next door safely. 1/2 x 1/2 = 1/4 .)
iii. The probability of survival is 1/6. (There is a 1/3 chance of making the first choice safely, then a 1/2 chance of making the second choice safely. 1/3 x 1/2 = 1/6.)
b. Room i for theft; room ii for assault, and room iii for murder. Murder is the most serious crime, followed by assault and then theft.
2. a–b. Answers will vary.