This is a level 3 algebra strand activity from the Figure It Out series.
A PDF of the student activity is included.
Click on the image to enlarge it. Click again to close. Download PDF (424 KB)
use graphs to show relationships in sequential patterns
graph paper
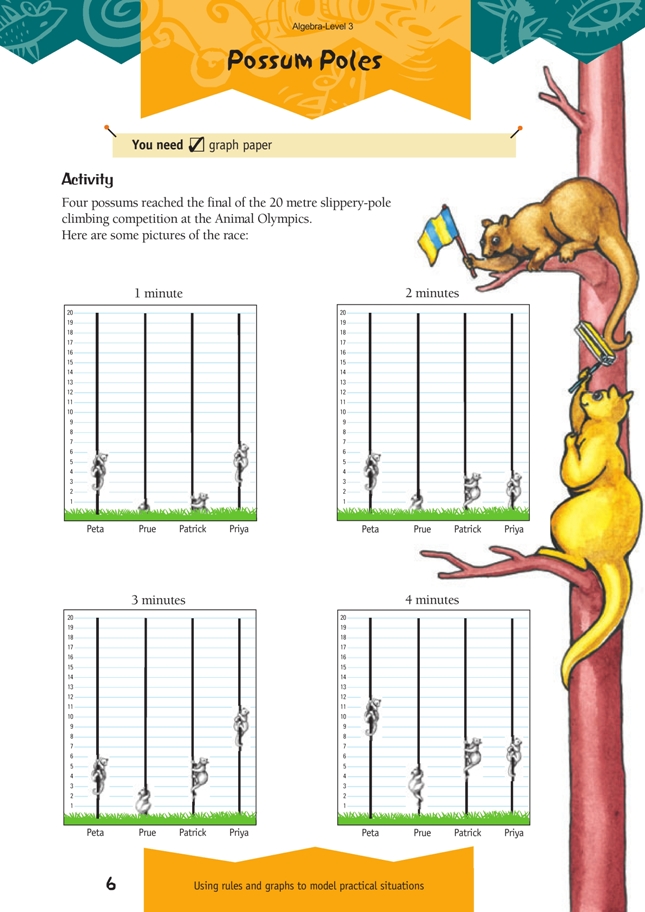
This activity will probably need teacher guidance. You could draw a set of axes and work with the class or group to record the progress of one possum on the graph.
If students have trouble converting the pictures to graphs, they could use a table as an intermediate step. This will help them to identify each possum’s climbing pattern.
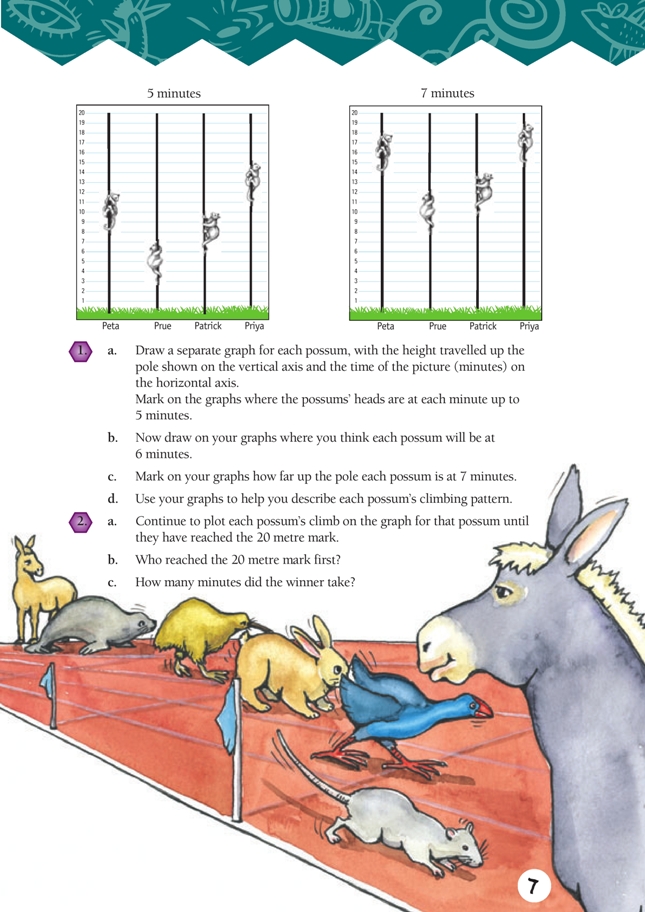
You may need to point out that the last picture shows the possums’ positions at 7 minutes, not 6 minutes as students may expect. The sixth minute has been missed out so that students can predict the position of the possums at that time (question 1b).
When students are plotting the points on a graph, make sure that they move both up the y axis and across the x axis by 1 minute for every new minute that they are plotting. Some students may forget to move across the x axis and move only up the y axis.
Question 1d asks students to interpret the graphs. You may want to help students with this. For example, the higher up the y axis, the further the possum has climbed. If the possum moves closer to the x axis, it has slipped down.
Students can use their descriptions of the possums’ climbing patterns to continue the graphs and answer question 2.
Answers to Activity
1. a., b., c.
In the graphs in the following columns, x marks the first 5 minutes (for question a),![]() shows the progress at 6 minutes (question b), and
shows the progress at 6 minutes (question b), and ![]() shows the progress at
shows the progress at
7 minutes (c).
d. Peta climbs 6 m in 1 minute and rests for 2 minutes.
Prue climbs 1 m per minute for the first 3 minutes, 2 m per minute for the next
3 minutes, and 3 m per minute for the next 3 minutes.
Patrick climbs 2 m every 2 minutes.
Priya climbs 7 m in 1 minute then slips 3 m in the next minute.
2. a. ![]() on each graph shows that the possum has reached the 20 m mark, and shows where they are at 8 and 9 minutes.
on each graph shows that the possum has reached the 20 m mark, and shows where they are at 8 and 9 minutes.
b. Priya reaches the 20 m mark before the other 3 possums.
c. Between 8 and 9 minutes. (Priya reached the 20 m mark in less than a minute after she had climbed for 8 minutes.)