This is a level 4 statistics activity from the Figure It Out series.
A PDF of the student activity is included.
Click on the image to enlarge it. Click again to close. Download PDF (742 KB)
interpret information from graphs
evaluate statements made about data
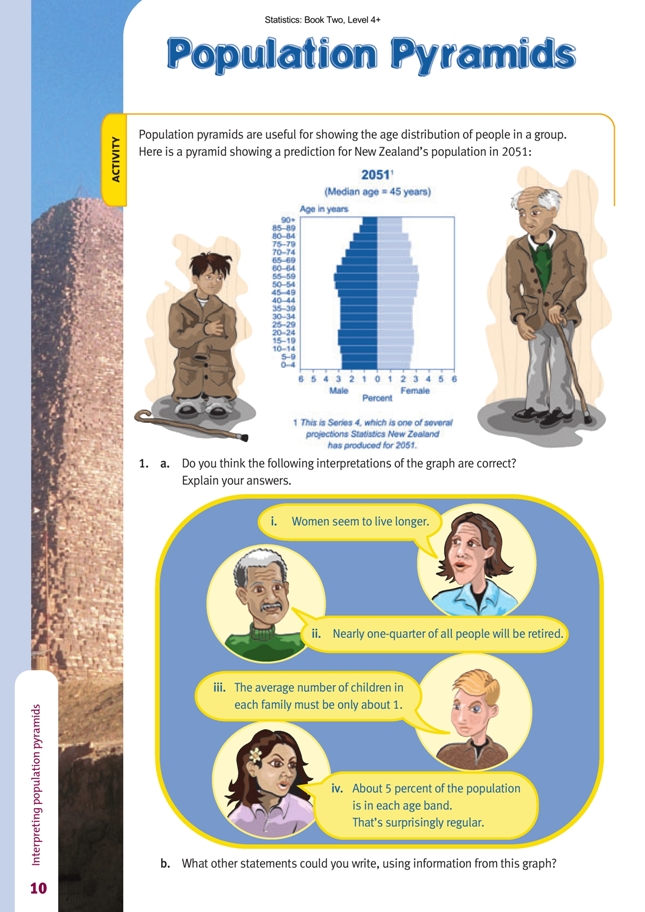
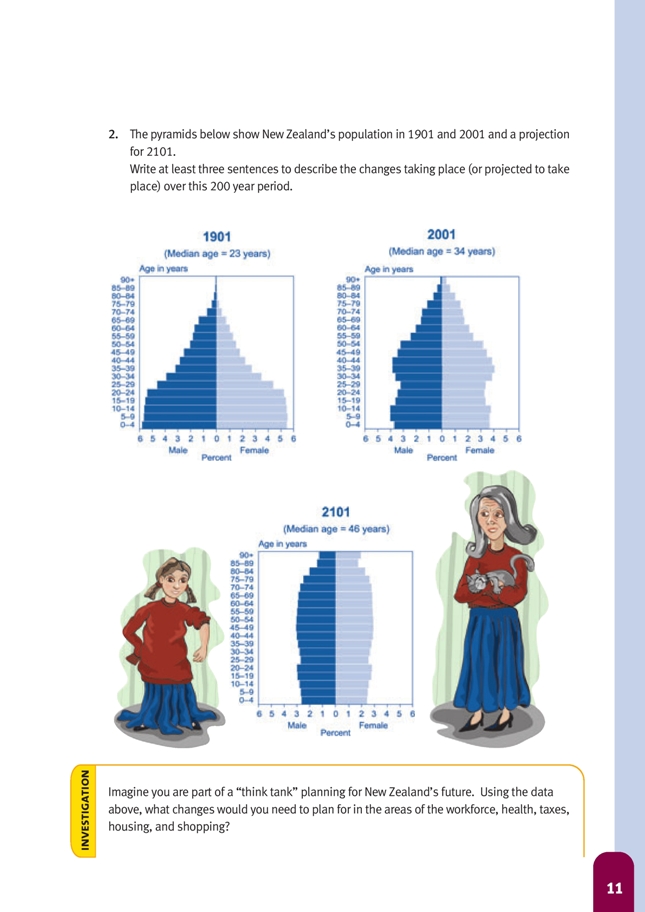
The population pyramids in this activity show changes and projected changes to the make-up of our population over a 200-year period.
The pyramids are back-to-back histograms placed on their sides. Back-to-back graphs such as these are useful for comparing two related sets of data in the same format, in this case, male and female population data for several different years. Examine with your students how the axes are drawn and labelled and how
the bars are drawn.
You should explain to your students that, although the pyramids are similar to histograms, each bar represents the proportion of the population, not the number of people, in that particular age band. This means that the sum of the lengths of the bars in any population pyramid will be 100 whether the population is 1 000 000
or 100 000 000. You could further explain this point by asking the students to compare the bottom bars of the 1901 and 2001 pyramids. They may think that, because the bars are much longer for 1901, there were a lot more children around then. What they show, however, is that about 11.5 percent of the population was
aged 0–4 in 1901, but only 6.6 percent was in 2001. An interested student could investigate whether 11.5 percent of the 1901 population was more or less than 6.6 percent of the 2001 population.
The pyramids for 1901 and 2001 contain hard data; those for 2051 and 2101 are projections based on assumptions. These assumptions concern the three main factors that determine whether a population increases or decreases over time. You could ask your students what they think these would be. They are:
fertility (the birth rate), life expectancy (mortality), and migration. You could go on to discuss with your students what other factors affect these factors and which of the three is the most volatile (likely to change in unpredictable ways).
The footnote to the 2051 pyramid explains that it is based on what Statistics New Zealand calls its Series 4 projections. This set of projections is one of eight. The series assumes that:
• women will have 1.85 children each on average (below the 2.1 children required for the population to replace itself without migration)
• life expectancy at birth will increase by about six years between 2001 and 2051
• there will be a net migration gain of 5 000 people each year (the average annual level for the last 100 years) from 2007 onwards.
Statistics New Zealand has put its data from 1951 to the present day and its Series 4 projections from the present day to 2051 onto its website as a downloadable database. Using this database, your students can find the data for each age band, by gender, for each year within the range. They can call up a population pyramid for any year or can select a group of cells from the database and create their own graphs without having to re-enter data. They can also find out more about the processes involved in making demographic projections. The main website is at www.stats.govt.nz.
Statistics New Zealand have education officers who produce resources such as the Statzing! leaflets (available for both primary and secondary levels) and send them to schools. The major CensusAtSchool project carried out by Statistics in 2003 provides an enormous database of real information that is relevant to young people
aged 8–15 and that you can access. The New Zealand database is part of a much wider international database that you can also access. Check out the Schools’ Corner at www.stats.govt.nz/schoolscorner
Cross-curricular links
Social Studies
The students’ book suggests an investigation that could form part of a unit on either social change or the future.
Achievement Objectives
Students will demonstrate knowledge and understandings of:
• how people organise themselves in response to challenge and crisis (Social Organisation, level 4)
• causes and effects of events that have shaped the lives of a group of people (Time, Continuity, and Change, level 4)
Answers to Activity
1. a. Answers and explanations will vary. Possible answers and explanations include:
i. Yes, this is a fair statement. Up to 74 years, the male and female bars are almost exactly the same length, but the four bars that represent women aged 75 and above are longer than the bars that represent men. This is especially true for the bars
that represent ages 89 and above.
ii. Yes, this is a fair statement, assuming that those who are 65 years and older are retired. The lengths of the six bars that represent this part of Pages 10–11 the population add up to very close to 25% of the total.
iii. This may be true, but there is not enough data in the graph to be sure. About 28% of the population is aged 20–44 (the age range of most parents when their children are born). About 22% of the population is aged 19 or less. This means that there is fewer than 1 child for each adult in the 20–44 year band.
iv. Yes, this is a fair statement. Except for the age bands that represent those who are aged 80 years and older, each band represents between 4.6 and 6.4% of the population.
b. Statements will vary.
2. Sentences will vary. Generally the median age of the population is increasing, so, as time goes by, there will be proportionally more older people and proportionally fewer younger people.
Investigation
Answers will vary.