In this unit students will identify how to plan and carry out a statistical investigation, looking at facts about their class as a context.
- Write investigative questions for statistical investigations and design a method of collection of data.
- Display collected data in an appropriate format.
- Make statements about implications or possible actions based on the results of an investigation.
- Make conclusions on the basis of statistical investigations.
It is vital when planning statistical investigations that the students understand the importance of the way that they plan, collect, record and present their information. If they are not consistent in the way they carry out any of these steps, they could alter their findings, therefore making their investigation invalid.
In this unit the students will first look at choosing investigative questions to explore, making sure that the topic lends itself to being investigated statistically. They will collect their data using structured recording methods. Once they have collected and recorded their data, they will present their findings, using appropriate displays, and make descriptive statements about their displays to answer the investigative question.
Dot plots
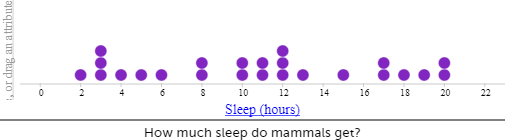
Dot plots are used to display the distribution of a numerical variable in which each dot represents a value of the variable. If a value occurs more than once, the dots are placed one above the other so that the height of the column of dots represents the frequency for that value. Sometimes the dot plot is drawn using crosses instead of dots.
Investigative questions
At Level 2 students should be generating broad ideas to investigate and the teacher works with the students to refine their ideas into an investigative question that can be answered with data. Investigative summary questions are about the class or other whole group. The variables are categorical or whole numbers. Investigative questions are the questions we ask of the data.
The investigative question development is led by the teacher. Through questioning of the students, the teacher identifies the variable of interest, and the group identifies what the investigative question is about. Within this, the teacher forms the investigative question but with student input.
Survey questions
Survey questions are the questions we ask to collect the data to answer the investigative question. For example, if our investigative question was “what ice cream flavours do the students in our class like?” a corresponding survey question might be “what is your favourite ice cream flavour?”
As with the investigative question, survey question development is led by the teacher, and through questioning of the students, suitable survey questions are developed.
The learning opportunities in this unit can be differentiated by providing or removing support to students and by varying the task requirements. Ways to support students include:
- directing students to collect category data or whole number data – whole number is more complex
- giving students summarised data to graph rather than them having to collect it and collate it
- giving students a graph of the display and ask them to “notice” from the graph rather than having them draw the graph
- writing starter statements that students can fill in the blanks to describe a statistical graph e.g. I notice that the most common XXXX is ________, more students chose _______ than chose _______.
The context for this unit can be adapted to suit the interests and experiences of your students.
For example:
- Suggesting ideas to investigate that reflect the local environment, such as favourite native bird, favourite beach, favourite landmark, etc
- Suggesting ideas to investigate that reflect the diversity of the students in your class/school, such as cultural identity, home language, holidays observed, etc.
Te reo Māori vocabulary terms such as raraunga (data), tauanga (statistics), tuaka (axis), and āwhata (scale) could be introduced in this unit and used throughout other mathematical learning.
- Paper and pencils
- Presentation materials
Although this unit is set out as five sessions, to cover the topic of statistical investigations in depth will likely take longer. Some of the sessions, especially sessions 4 and 5 could easily be extended as a unit in themselves. Alternatively, this unit could follow on from a unit on data presentation to give students an appreciation of practical applications of data display.
Session 1
Session 1 provides an introduction to statistical investigations. The class will work together to answer the investigative question – How many brothers and sisters do people in our class have? Be sensitive to the needs of your class - if this context is inappropriate for your students , then it may need to be altered.
- Explain to the class that their job for maths this week will be to gather information or data on the class, summarise the information, or data, collected and then present this as a report which will be sent home to parents and displayed in the class.
- Ask students whether they can explain what the word statistics means.
Explain that statistics concerns the collection, organisation, analysis and presentation of data in a way that other people can understand what it shows. - Explain that the class will work in small groups, each of them with the job of finding out information about the class.
- First we will work as a whole class to answer the investigative question:
How many brothers and sisters do people in our class have? - Ask the students what information we need to get from everyone in the class to answer our investigative question.
Students might suggest that we ask how many siblings they have, or they might suggest we ask how many brothers, how many sisters and how siblings they have altogether.
The idea of asking about brothers and sisters separately allows for a deeper exploration of the data and a more in depth answer to our investigative question. - Agree as a class to ask about the three pieces of information. See if anyone can suggest how we could collect the data.
- Working with student ideas, move towards a solution whereby each student records their information on a piece of paper.
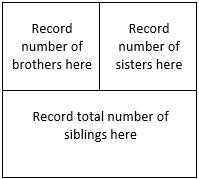
Sticky notes could be a good way to collect this information from the students as it will allow rearrangements of the data quickly. - Suggest that the students divide their paper into three as shown in the diagram below to answer three survey questions.
- How many brothers do you have?
- How many sisters do you have?
- How many siblings do you have (or total number of brothers and sisters)?
- Get the students to fill in their responses for their brothers and sisters. Check what a response of zero means – in one or all the sections (no brothers/no sisters, no siblings/only child)
- Work with a partner to check that the information is correct and in the correct place. A good way to do this is for the partner to take the piece of paper and describe to another student the number of brothers and sisters the student has.
For example:
Pip records the following information about her brothers and sisters. She gives it to her partner. Her partner, Kaycee shares this information with another student. Kaycee says that Pip has three brothers and one sister. Altogether Pip has four siblings.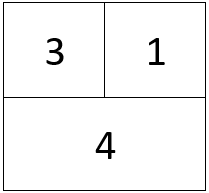
- Collect all the pieces of paper (or sticky notes) and ask:
How can we use the pieces of paper (or sticky notes) to show someone else how many brothers and sisters people in the class have?
How can we show the information so that people can easily understand what it is showing?
Hopefully, someone will suggest a more organised list, or counting the number of 0s, the number of 1s etc and writing sentences to explain how many there are of each. - Carry out these suggestions to show how much clearer they make the information.
- Ask for suggestions for other ways to show the information. If nobody suggests it, introduce the idea of using a dot plot.
- Demonstrate how to draw a dot plot of the information, ensuring that you highlight important features of dot plots; axis, scale and labels on the axis, title (use the investigative question), and accurately plotted points.
- Students could draw their own versions as a practice exercise. It may be useful to provide a template with an appropriate scale for students to use.
- Encourage students to draw separate graphs showing just brothers and just sisters as well.
- Now that we have made a display of the data, in this case a dot plot, we need to describe the dot plot.
- Ask the students what things they notice about the data. Record these ideas on the board. Write the words “I notice…” on the board or chart paper and capture ideas under this. They might notice:
- What is the most common number of siblings/brothers/sisters?
- The largest number of siblings, the smallest number of siblings
- Where most of the data lies e.g. most of our class have 2-4 siblings.
- Work with the students to tidy up their statements to ensure that they include the variable and reference the class. For example:
- The most common number of siblings for people in our class is 2.
- The largest number of siblings in our class is 7.
- Most of the people in our class have between 2 and 4 siblings.
- Explain that over the next few days students will be investigating some other ideas about the class, making their own graphs to show the information and describing what the information shows.
Session 2
This session is ultimately about choosing an appropriate topic to investigate about the class. There will be a real need for discussion about measurable data and realistic topics that can be investigated in the given time frame. It would be a good idea to provide the students with a list of topics if they get stuck, but they should be encouraged to try and come up with something original where possible.
- Recap the previous session’s work, discussing how the information was collected, how it was presented, and how it was discussed.
PROBLEM: Generating ideas for statistical investigation and developing investigative questions
- Explain that in this session students will work in small groups to come up with three topics to explore about the class. The topics need to be ones that they can collect information from the class about and therefore complete the investigation.
- Discuss criteria that the topics must meet.
- Is this a topic that the students in our class would be happy to share information with everyone?
- Would the topic apply to everyone in the class?
- Is the topic interesting or purposeful?
- Put students into small groups and give them a few minutes to come up with some ideas that they think they might use. Try to group together students with different levels of competence and encourage tuakana-teina. Encourage them to think of topics that use categories and topics that use counts (e.g. number of siblings). Ideally they should have at least one of each across their three topics.
If groups are having trouble thinking of ideas, you could try writing a list of suggestions on the board but limiting groups to using one of your ideas only, to encourage them to think of their own. Some ideas could be:- Favourite flavour of ice cream/pizza/soft drink etc.
- Favourite pet
- Number of pets
- Colour of eyes
- Shoe size
- Favourite native bird
- Favourite beach
- Cultural identity
- Birthday month
- Home language
- Number of skips (using a skipping rope) in 30 seconds
- Number of hops in 30 seconds
- How they travel to school
- Number of (whole) hours sleep the previous night
- Number of languages students speak
- Number of letters in their first name
- Number of letters in their first and last names
- Number of items in their school bag
- Once groups have decided on their topics, work with them to pose investigative questions. Model examples of these to help the students pose their own.
- How many brothers and sisters do people in our class have?
- What are Room 30’s favourite pets?
- What are Room 30's favourite native birds?
- What eye colours do the people in our class have?
- What cultures are present within Room 30?
- How did Room 30 students get to school today?
- How long are our class’s first names?
- When are Room 30’s birthdays?
- Once they have posed their investigative questions, share them as a class, and ensure that they are all appropriate, checking in on the criteria specified in 3.
- If groups need to change any of their investigative questions, give them time to do so now.
PLAN: Planning to collect data to answer our investigative questions
- Explain to the students that they need to think about what question or questions they will ask to collect the information they need to answer their investigative question.
Explain that these questions are called survey questions and they are the questions we ask to get the data. Work with groups to generate survey questions. For example:
- If the investigative question is: “What are Room 30’s favourite pets?”, ask the students how they could collect the data.
- A possible response is to ask the other students “What is your favourite native bird?”
- Also, the students might want to ask, “What is your favourite native bird out of Tūi, Kiwi, Kerēru, or Kea?” You could challenge them as to if this would really answer the investigative question and suggest that possibly they might change the survey question to allow for other answers.
Possible survey questions are:
- What is the colour of your eyes?
- How did you travel to school today?
- What language do you speak at home?
- What culture do you mostly identify with?
- What month is your birthday?
In these examples you can see that the survey question and investigative question are very similar, but there are key differences that make it an investigative question (What are Room 30’s favourite native birds? – overall about the class data) rather than a survey question (What is your favourite native bird? – asking the individual).
- Ensure that all groups record their investigative and survey questions for the next session.
Session 3
Data collection is a vital part of the investigation process. In this session students will plan for their data collection, collect their data and record their data and summarise using a tally chart or similar for analysis in the following sessions.
PLAN continued: Planning to collect data to answer our investigative questions
- Get the students to think about how they will record the information they get. Options may include:
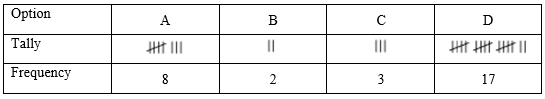
- Tally chart
- Writing down names and choices
- Using predetermined options
- Using a class list to record responses
- Let them try any of the options they suggest. They are likely to encounter problems, but this will provide further learning opportunities as they reflect on the difficulties and how they can improve them.
DATA: Collecting and organising data
- Students collect data from the rest of the class using their planned method. Expect a bit of chaos. Possible issues aka teaching opportunities include:
- Predetermined options
- What happens for students whose choice is not in the predetermined options?
- What if nobody likes the options given and they end up with a whole lot of people choosing the 'other' category and only have tally marks so they cannot regroup to new categories?
- Using tally marks only
- The discussed issue about the “other” category
- Have less tally marks than the number of students in the class
- and they think they have surveyed everyone
- or they do not know who they have not surveyed yet
- Have more tally marks than the number of students in the class
- Possible solutions to the above issues could be (generated by the students)
- Recording the name of the student and their response and then tallying from the list
- Giving everyone a piece of paper to write their response on, then collecting all the papers in and tallying from the papers
- Predetermined options
- Regardless of the process of data collection we are aiming for a collated summary of the results.
Session 4
In this session the students will work on creating data displays of the data collected in the previous session.
ANALYSIS: Making and describing displays
Numerical data – displaying count data e.g. “How many…” investigative questions
- Show the dot plot created in Session 1 of numbers of siblings.
- Discuss how it was made and what needs to be included on it.
- Get students to identify which one (or more) of their investigative questions involves count data. Choose one of these to work on first if they have more than one.
- Give students time to work on their first graph, providing support as required. Providing pre-drawn axes may be useful, but students may still need help selecting an appropriate scale to use and placing the “dots”.
- After all students have completed one of their graphs, bring the class together to share what students have done.
- Discuss and compare graphs between groups.
Categorical data – displaying data that has categories e.g. “What…” investigative questions
- Get students to identify which one (or more) of their investigative questions involves category data. Choose one of these to work on first if they have more than one.
- Ask students if they can remember how to graph categorical data (you may have already done some work on using pictographs or bar graphs e.g. Parties and favourites). Reference back to this previous work and discuss how it was made and what needs to be included.
- Give students time to work on their categorical data graph, either a pictograph or a bar graph. You may want to encourage a bar graph depending on how much statistics you have already done prior to this unit.
- After all students have completed one of their categorical data graphs bring the class together to share what the students have done.
- Discuss and compare graphs between groups.
- Send students to work on the last graph of their three.
Session 5
Session 5 is a finishing off session. Students should be given time to complete their graphs if they have not already, and to write statements about what the graphs show.
- Give groups time to finish graphs as required.
- Students should also write statements under each graph telling what the graph shows. Ideas for describing graphs were discussed in session 1. Refer to these ideas. In addition, starters for these statements could be given:
- The most popular…
- The most common…
- The least popular…
- The least common…
- Most students in our class…
- The largest number of…
- The smallest number of…
- Check their descriptive statements for the variable and the group. For example, favourite pets and our class; travel to school and Room 30.
- Discuss with the students whether there is any action we should take as a result of any of the information we have found out in our investigations.
- Ask if there are any conclusions we can make from the investigations we have done.
- Students could compile their displays as a booklet to take home to their families entitled "About our class" or similar. Alternatively, create a class display of the findings, or share them with another class.
Dear parents and whānau,
During the next week we will be working on statistical investigations in maths. Over this time, your child will be gathering data on the class and presenting it using data displays such as dot plots and bar graphs. If you know of any graphs or tables of information suitable to discuss with your child, either in the newspaper, or in a book, or perhaps on some advertising material, this week would be a good time to do so.