This is a level 3 statistics activity from the Figure It Out theme series.
A PDF of the student activity is included.
Click on the image to enlarge it. Click again to close. Download PDF (497 KB)
construct a bar graph
interpret data from a graph
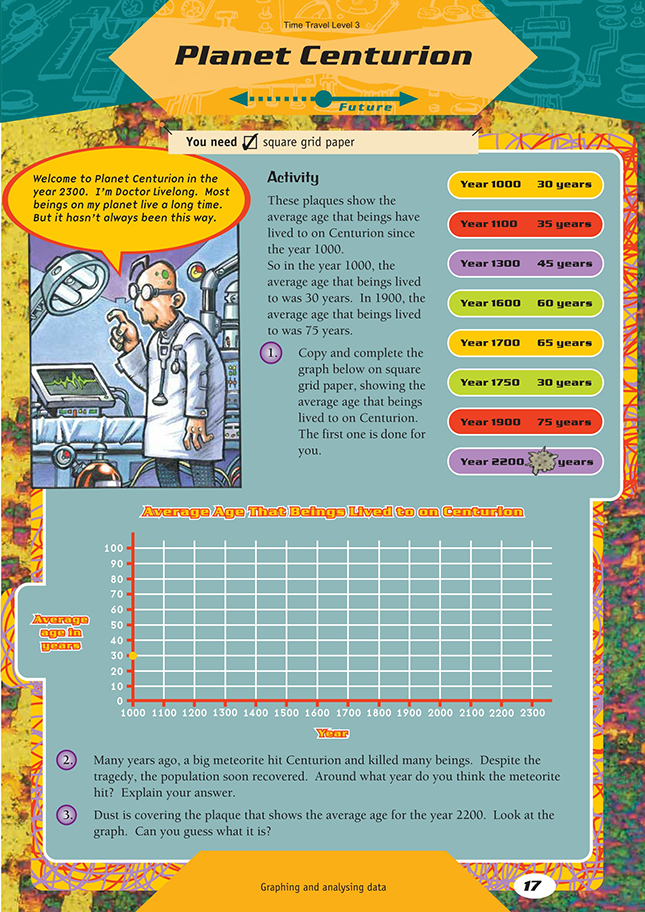
FIO, Level 3, Theme: Time Travel, Planet Centurion, page 17
Square grid paper
This activity is about graphing data. The graphed data shows patterns in the data more clearly than data listed as numbers, and this makes the data easier to analyse.
When the students graph their data, make sure they plot the xco-ordinate correctly. Although the x axis of the graph is marked with regular 100 year intervals, the data is not given in regular intervals. For example, the difference between the first and second plaque is 100 years, but the difference between the second and third is 200 years.
The activity introduces the concept of an outlier, which is a piece of data that is outside the trend shown by the other data in a set. Discuss with the students how to recognise outliers in data displays. It is important for the students to investigate why outliers are sometimes present in data sets. Outliers are often the cause of a problem that researchers are trying to solve when they study data sets. Also, it is important to be aware of any outliers because they can affect the averages of data sets.
In question 3, the students have to extrapolate the data to estimate the average age in 2200. To do this, they continue the line of the graph, excluding the outlier, until they are directly above 2200 on the x axis. They can then see what number on the y axis they are aligned with.
As an extension, you could discuss the concept of life expectancy with the students and ask them why they think it fluctuates (that is, what causes increases or decreases in life expectancy). The students could then investigate how much life expectancy has changed in New Zealand over the last 200 years. They could look in the New Zealand Official Yearbook or on the website of Statistics New Zealand (www.stats.govt.nz).
Note that life expectancies for men and women are different. You could discuss with the students why this could be.
You could link this activity to social studies with an investigation of life expectancies in countries around the world. The students could interpret events such as medical advances, economic prosperity, increased technology, and war as having a direct and graphic effect on life expectancy.
Discuss with the students if these events would lead to outliers in their data displays or alter the life expectancy trend in any way.
Answers to Activity
1.
2. Around 1750 as this year lies outside the pattern formed by all the other years
3. 90 years