This is a level 4 number activity from the Figure It Out series. It relates to Stage 7 of the Number Framework.
A PDF of the student activity is included.
Click on the image to enlarge it. Click again to close. Download PDF (663 KB)
round numbers
estimate a percentage
match a percentage to a shaded region of a whole
A classmate
A calculator
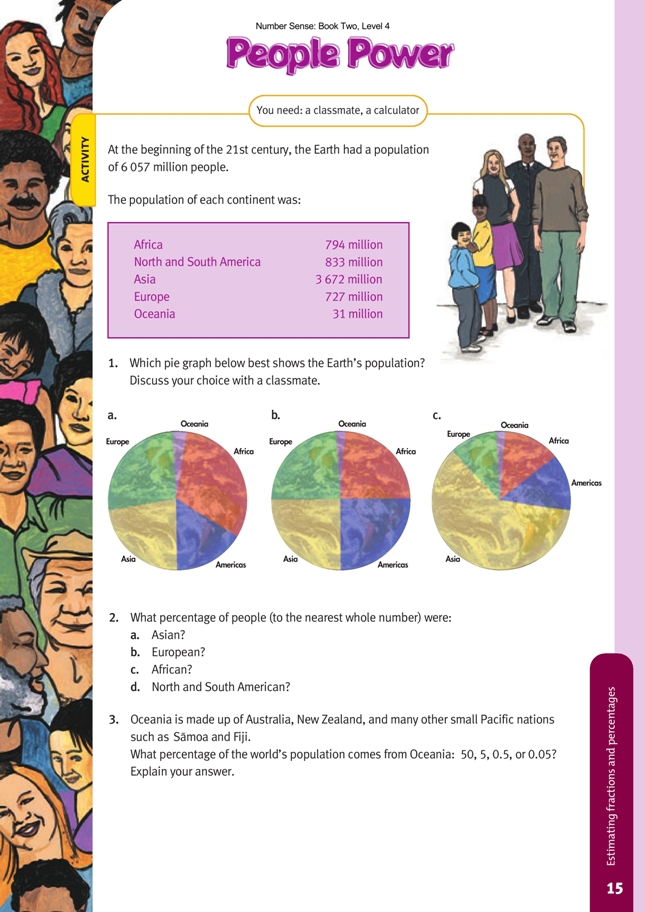
For question 1, the students need to change each population group into fractions of the total human population for comparison with the pie graphs. Encourage the students to attempt this before picking up a calculator. They may notice that Asia makes up half the world’s population and that only graph c fits this condition. This
would be justification enough for giving c as the answer to this question. Alternatively, they can create a table, such as the one below, to supply the answers to both questions 1 and 2. The decimal fractions can be calculated by dividing each population group by 6 047 million.
Note that the rounding effect means that the fractions add up to slightly more than 1. This could be corrected by using more figures, for example, 0.6062 for Asia, and so on.
For question 1, it is now just a matter of inspecting the pie graphs and looking for one that shows Asia with more than half the population (0.61), and Africa, North and South America, and Europe with approximately the same amount each. As before, the only graph that fits this specification is c.
The students could derive the results for question 2 directly from the table above, or an additional column could be added showing the equivalent percentages. It is just a matter of multiplying the decimals by 100 to get the percentages. What this means in practice is that all the digits are simply shifted two columns to the left. For example, 0.13 becomes 13 percent. The percentage column will then be:
Note that, here again, rounding means that the total adds up to over 100 percent.
This addition to the table also enables a ready solution to question 3. Oceania has only half of 1% of the human population. This makes sense because, as the answers point out, 60 million would be approximately 1% of the total population (60 is roughly one-hundredth of 6 147), so Oceania’s population of 31 million
would be approximately half of this 1%.
Answers to Activity
1. Graph c is the correct one.
2. a. 61%
b. 12%
c. 13%
d. 14%
3. 0.5%. 1% would be about 60 million, and Oceania has half that population.