This is a level 4 activity from the Figure It Out series.
A PDF of the student activity is included.

Click on the image to enlarge it. Click again to close. Download PDF (1667 KB)
Probability is the likelihood of an event occurring, for example, the likelihood of throwing a 5 on a dice is 1/6. Experimental situations help students develop their understanding of chance and probability. Data-handling skills, such as gathering and organising data, also come into play. Meaningful learning takes place when a student’s intuitive understandings of probability are challenged by the results of an experiment.
classmates
4 dice
24 counters
Pedal Power board game (see copymaster)
In these activities, students learn about a bicycle-sharing system and use experimental estimates of probability and theoretical probability to explore the likelihood of getting specific sums when two dice are thrown.
Activity One
Interpreting information from a table is an important everyday skill. Some students may forget to add the daily fee of $2.50 when working out the cost of the bicycle trips.
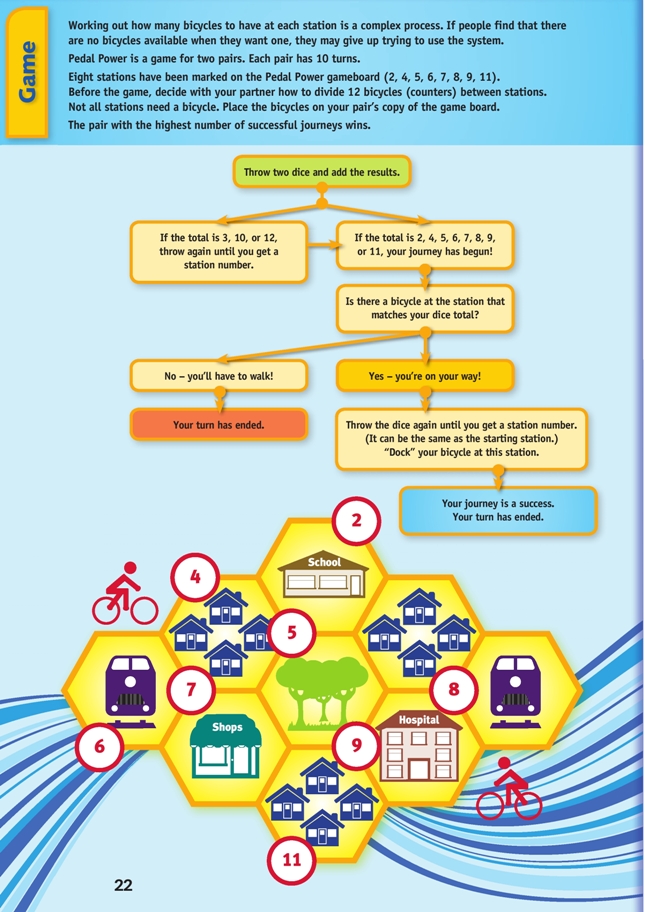
Game
Journeys can start and finish at the same station – this implies that the cyclist has completed a short errand.
At first, students may spread their bicycles evenly across the stations. This may work, but the theoretical probabilities mean that some stations are more likely to be used than others. The game can be played again after investigating the probabilities in Activity Two. Discuss with the students how they could use the results of their investigation to improve the likelihood of success.
Activity Two
Probability can be a difficult concept for students to grasp. When two dice are thrown and the results added, several sums are possible. In this activity, students examine why some sums are more likely to be thrown than others.
Discuss the language of probability with the students.
When a pair of dice is thrown, there is no way to state with confidence what the outcome will be. It could be any value between 2 and 12. However, some sums are more likely to occur than others. If we throw two dice 100 times, we would expect there to be more sums of 7 than sums of 2.
The likelihood of an event occurring (for example, getting a sum of 8) is the same as its probability.
In some cases, the theoretical probability of an event can be worked out by, for example, listing all the possible outcomes and seeing how many times the event is represented.
Experimental estimates of probability involve conducting a number of trials and using the results to estimate the probability of an event. The more trials we do, the closer the experimental estimate of probability will be to the theoretical probability (if this can be determined). This principle is sometimes referred to as the law of large numbers.
Reinforce to the students that although each number on a single dice has an equal chance of being thrown, when two dice are thrown the possible sums (2 – 12) are not equally likely.
Students are instructed to throw the two dice 40 times. The more trials they conduct, the more likely the results are to align with the theoretical probabilities. Combining the results of everyone in the class means that the number of trials increases dramatically.
It is important to link these three concepts:
- Students will each obtain their own unique set of results.
- When the results for the class are combined, a pattern will emerge. The combined results should reflect the theoretical probabilities.
- While theoretical probabilities show which sums are more likely to be thrown, they do not enable us to confidently predict a particular outcome or the set of results a particular student will get.
Probability is most useful when it comes to predicting long-term results. A frustrating aspect of probability is that, even if we know the theoretical probability of each sum, this knowledge may not help us predict what will happen in a short-term situation like a game. Throwing four 5s in a row is unlikely, but it’s not impossible. If students put more bicycles on stations 6, 7, and 8, they may have more successful trips, but then again, they may not. However, if all students take this approach, some students will have less successful journeys, but overall the class should have more successful journeys than if the bicycles had been distributed either randomly or equally. Investigate this with the class.
The Pedal Power game has some similarities to the board game Settlers of Catan. If your students have access to this game, encourage them to use their understanding of probability to decide where to place their game pieces.
Dealing with uncertainty and variation develops the key competency thinking.
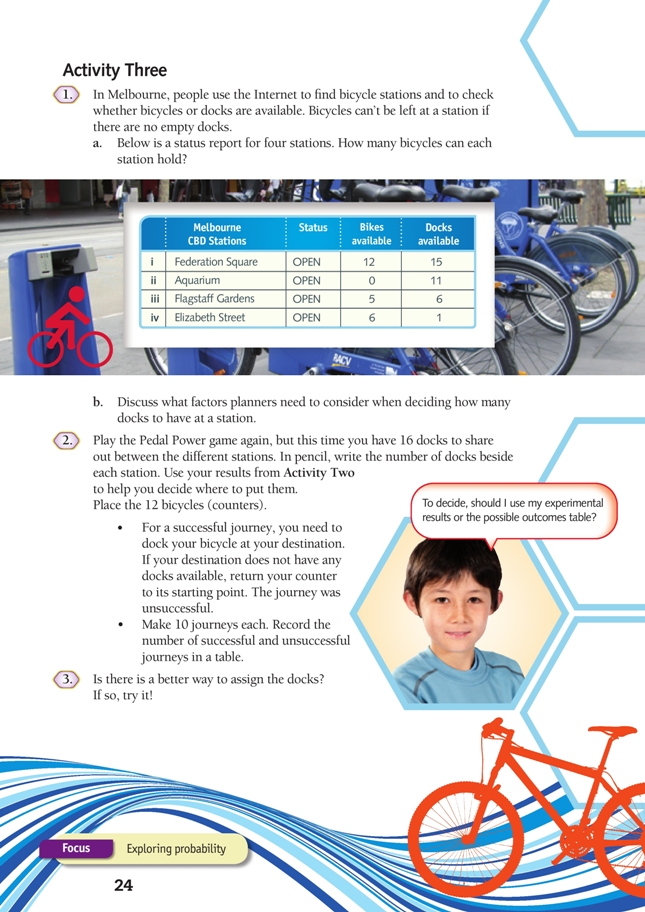
Activity Three
In the previous version of the game, a bicycle could be placed at any of the stations, but in this new version, the station must have an available bicycle dock. Students allocate 16 docking spaces between all the stations.
Ask the students to discuss the question that Jun raises: Should they use the experimental results or the information in the “possible outcomes” table? Or is “chance” still the best bet?
Technology-related student activities
- Discuss whether a bicycle-sharing system would work in your area. Why or why not?
- Research the evolution of transportation control systems such as traffic lights, railway switches, or air traffic control.
Exploring the technology-related context
All forms of transportation need technology. Advances in transportation methods affect human interactions, for example, commerce and social relationships.
Many transportation techniques rely on fossil fuels. Increasing awareness of how these technologies affect the environment is leading some people to actively explore or use more sustainable alternatives.
Transportation technology is not used only in forms of transport but also in technological control systems, such as traffic lights.
Answers
Activity One
1. Jane: $2.50 + $2 = $4.50
Thomas: $2.50 + $0 = $2.50
Steve: $2.50 + $10 = $12.50
Molly: $2.50 + $2 + $0 = $4.50
2. a. 4 days. Buying 4 daily passes would be more expensive than buying a weekly pass. 4 x $2.50 = $10
b. 21 days. The cost of 20 daily passes is the same as an annual pass (20 x $2.50 = $50), but 21 days gives a free day (and each day after that is free).
c. Nick should buy weekly passes. If he uses the bicycles most weekdays, the weekly pass is cheaper than buying 4 or 5 daily passes each week. 1 month is approximately 4 weeks. 4 weekly passes cost $32.00. This is cheaper than an annual pass.
Game
Practical activity
Activity Two
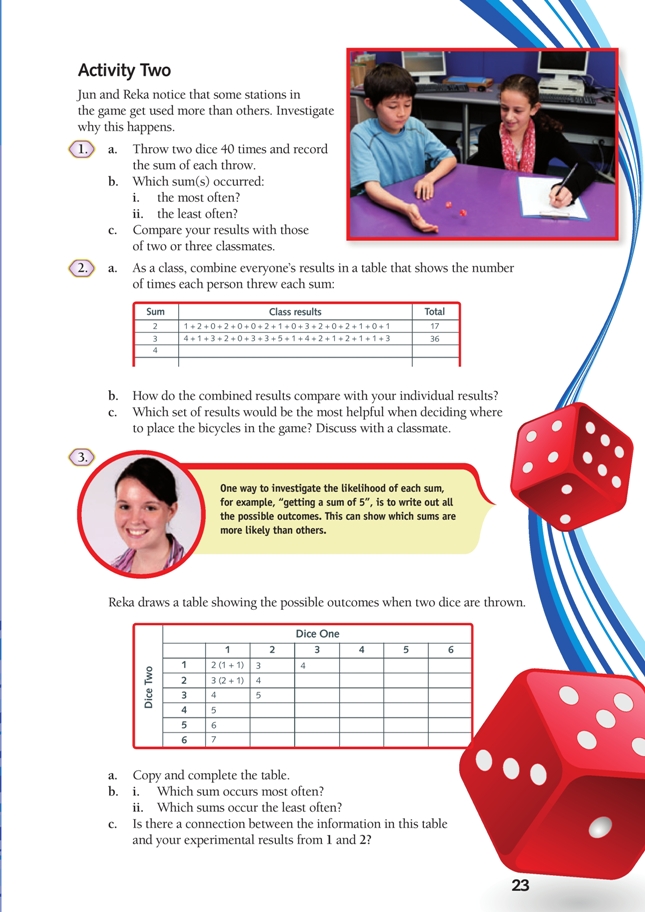
1. a.–c. Practical activity. Results will vary. It is likely that the totals 6, 7, and 8 were thrown most often.
2. a. Answers will vary.
b. There is likely to be some variation between individual results and the combined class results.
c. The combined class results are more useful. The more trials that are carried out, the closer the results will be to the actual probability or likelihood of getting each total.
3. a. 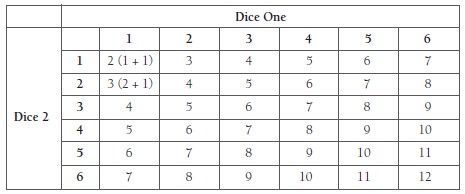
b. i. 7
ii. 2 and 12
c. Answers will vary, but it is likely that the totals that occurred least and most often in the combined class results will be the same as those that occurred least and most often in the table.
Activity Three
1. a. i. 27
ii. 11
iii. 7
iv. 7
b. Answers will vary. Planners need to consider: patterns of use, for example, stations positioned near a train station may need more bicycles than a station near a park; the expense of providing too many docks at a station that will not be used much.
2.–3. Practical activities