This is a level 3 and 4 statistics activity from the Figure It Out series.
A PDF of the student activity is included.
Click on the image to enlarge it. Click again to close. Download PDF (1219 KB)
decide what graph best represents the data
pose questions suitable for a likert scale
This diagram shows the areas of Statistics involved in this activity.
The bottom half of the diagram represents the 5 stages of the PPDAC (Problem, Plan, Data, Analysis, Conclusion) statistics investigation cycle.
A classmate
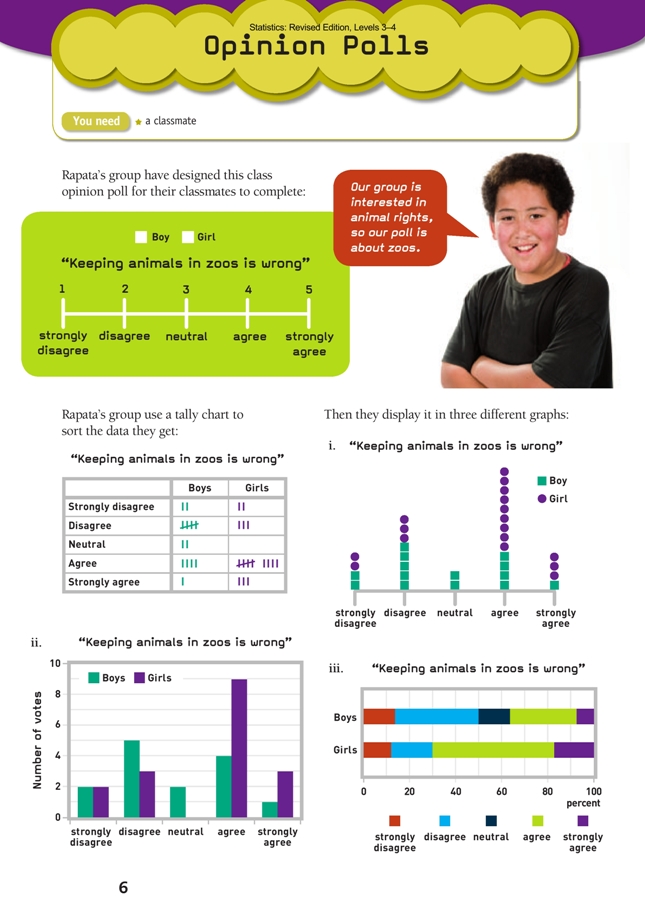
In these activities, students interpret different graphs showing the results of an opinion poll. They also devise questions suitable for an opinion poll that uses a Likert scale.
Activity One
This activity makes use of a kind of category data: the categories are the five opinions that respondents are allowed to hold; but unlike most category data, the categories come with an inbuilt order that needs to be maintained. Many surveys use a 5-point scale like the one in this activity (often referred to as a Likert scale – see the notes for Activity Two).
Questions 1 and 2 relate to what the graphs show and how well they show it. The tally chart and graphs i and ii are just different ways of presenting the same thing: in each, a tally mark, symbol, or unit of height represents a vote. Suggest to your students that they imagine graph i rotated 90 degrees clockwise and then compare it with the tally chart. Suggest also that, by cutting and pasting, graph i might easily be turned into graph ii. How?
Graph iii is a completely different kind of graph: a 100% stacked bar graph, which is a form of strip graph. Like a pie chart, this type of graph shows the proportion (rather than the number) of data belonging to each category. Be aware that students fi nd it diffi cult to manually create 100% stacked bar graphs and pie charts because they must calculate and then mark off the correct parts of the strip or circle. This requires proportional reasoning as well as measurement and construction skills. Both types of graph are, however, very easy to create by computer.
Graph iii is the only graph that takes account of the gender imbalance. In effect, each boy gets slightly more of the strip’s length than each girl. This is why the two “strongly disagree” sections are of slightly different length even though the data shows that the number of votes in this category was the same (2) for both boys and girls.
Activity Two
Opinion polls often present assertions and ask the respondent to agree or disagree with varying degrees of emphasis.
The Likert Scale, named after its orginator Rensis Likert (an American educator and
organisational psychologist, 1903–1981), is an ordered, one-dimensional scale, typically offering between four and seven options for respondents to choose from (fi ve is particularly common).
Numbers (such as 1 to 5) are usually assigned to each option. The options typically also include labels, although sometimes only the extremes are labelled. The Likert scale is also known as the “summative scale” since a result is often obtained by summing the number values attached to the various response options.
Examples:
I like going to Chinese restaurants
![]()
When I think about Chinese restaurants, I feel:
![]()
A benefit of the Likert Scale is that it offers unambiguous options and so leads to consistent answers. A disadvantage is that the Likert scale offers only a few options and respondents may not fully agree with any of them.
There is much debate about how many options should be offered. An odd number allows respondents to sit on the fence, while an even number forces them to take a side even when this does not refl ect their true position. The more options offered, the greater the chance respondents will be able to match their opinions to the available options, but a greater number of options means less clarity and more work for the administrator.
As with any other measurement tool, the questions and statements and the options offered should be carefully calibrated so that together they give a useful and coherent picture.
If carrying out a survey that uses a Likert scale (or even a three-point scale: agree / neither agree nor disagree / disagree), students need to be aware that negatively phrased questions or statements (for example, “Birds should never be kept in cages”) are often misinterpreted and invite respondents to circle options that actually say the reverse of what they mean. Positively expressed, non-extreme statements or questions are preferable.
Activity Three
This activity is best done as a homework exercise. The students can then share their findings with their classmate the following day. For more able students, this activity could lead to discussion about bias.
Answers to Activities
Activity One
1. a. Most students had an opinion for or against the statement in question.
Approximately one-quarter of them (8) felt strongly about it (either for or against
the statement).
b. More girls (12) than boys (5) agreed with the statement. More people agreed with the statement (17) than disagreed (12).
c. Comments will vary. It might be that this class has strong views on animal
rights or that few class members have visited a modern zoo and seen the
conservation work they do.
2. Graph i clearly shows that most people agree with the statement. It is also clear that most of the students in the two “agree” columns are girls.
Graph ii clearly shows that more girls than boys agree with the statement.
Graph iii clearly shows the percentage of boys and girls who responded in each of the five categories (for example, 70% of girls agreed or strongly agreed with the statement, compared with 37% of boys).
3. Discussion will vary. For this particular survey, even if there were 3 more boys to balance the genders and all 3 boys disagreed with the statement, there would still be more support than opposition. And even if all three boys supported the statement, there would still be more girls than boys who agreed with it. So the gender imbalance doesn’t alter the overall opinion poll result.
Activity Two
1. Discussion will vary. Likert scales suit opinions on one particular issue. For example, you couldn’t use a Likert scale to investigate choices such as favourite foods.
2. Statements will vary. For example:
“There should be more sports time during the school week.”
“Every school should have a uniform.”
“People who use cellphones while driving should lose their licences.”
“Soft drinks should be banned from school premises.”
Activity Three
Investigations, feedback, and improvements will vary. For example, in the case of the “time for sports” statement (above), it would need to be made clear whether sports time includes lunchtimes and/or after school, or just class time.
Key Competencies
Opinion Polls can be used to develop these key competencies:
• using language, symbols, and texts
• managing self
• relating to others.