This is a level 3 statistics activity from the Figure It Out theme series.

Click on the image to enlarge it. Click again to close. Download PDF (480 KB)
show data on a graph or table
answers questions from graph or table
FIO, Levels 3-4, Theme: Sport, Olympics Locations, pages 2-3
An altas
A classmate
For question 1, if the students have difficulty establishing a pattern in the years on which the Olympics were held, suggest that they take five consecutive dates from the display. This will help them focus on the numbers rather than the extraneous information. Ask: “What do you do to 1968 to get 1972 that you also do to 1972 to get 1976?” (Add 4 years.)
This pattern of fours was interrupted after the 1992 Olympic Games. Since then, the Olympics have alternated between the winter and summer games every 2 years. Suggested reasons for this change are given in the Answers.
The best graph for questions 2a and 3a, which focus on the continental locations of the Summer and Winter Olympics, is a bar graph, as shown in the Answers. Explanations for venue choices are also given in the Answers. The students may not have thought about Antarctica as a continent, so this could be a useful discussion point. They should be able to come up with plenty of reasons why it has never been considered as an Olympic venue.
Answers to Activity
1. a. Both Summer and Winter Olympics used to be held in the same year, at 4-yearly intervals. The pattern changes after 1992, with the summer and winter games held alternatively every second year. Both games are still held every 4 years, as before.
Reasons for this could include spreading out the cost of travel for people going to watch both games and spreading out the costs for countries supporting their sportspeople financially.
b. Because it was 100 years since the first Olympics, which Greece hosted
2. a. A possible graph is:
A possible table could look like this:
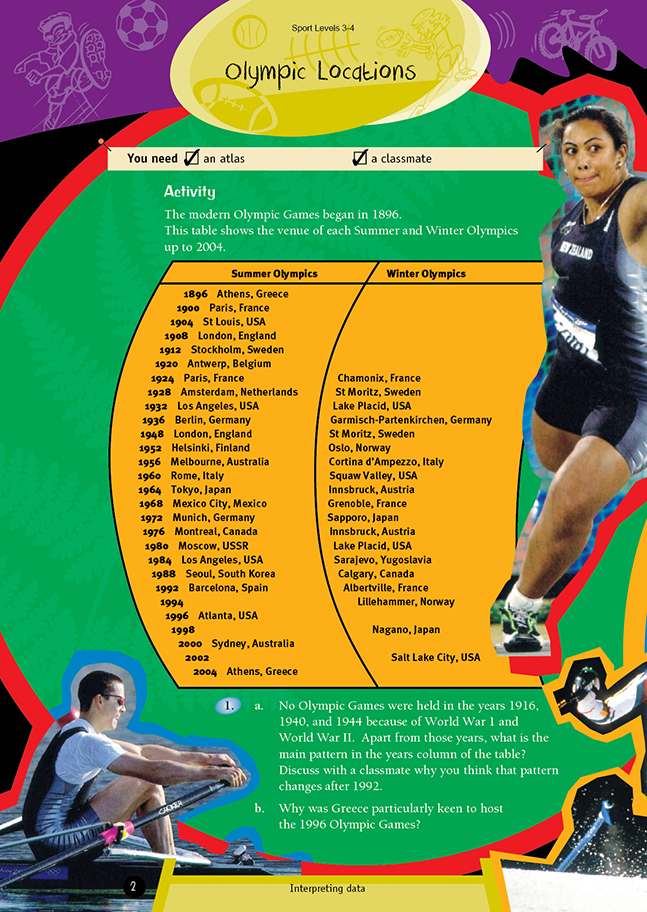
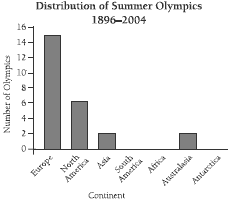
b. Europe has hosted the most Summer Olympics (14).
c. Africa, South America, and Antarctica have hosted the least (0).
d. Answers will vary. Europe has hosted the summer games more than any other
continent, partly because the Olympic revival movement started in Europe but
also because Europe contains many countries with sufficient wealth to host the
games. This would include being able to pay for the security required for athletes and
important visitors. Antarctica is not suitable for any games, and most places in Africa
and South America probably lack the funding required.
3. a. A possible graph is:
A possible table could look like this:
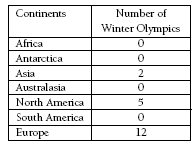
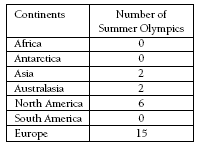
b. Europe has hosted the most Winter Olympics (12).
c. Africa, South America, Australasia, and Antarctica have hosted the least (0).
d. Answers will vary. The events held in the Winter Olympics are restricted to countries that have cold temperatures or mountainous areas. These events also require expensive equipment and are therefore most popular in wealthy countries.