This is a level 5 geometry activity from the Figure It Out theme series.
A PDF of the student activity is included.
Click on the image to enlarge it. Click again to close. Download PDF (354 KB)
draw pathways using vectors
Copymaster of Map
FIO, Levels 4-4+, Theme: Disasters Strike!, Oil Spill, pages 2-3
Other mathematical ideas and processes
Students will also:
• draw vectors on a grid when given the components
• explore vector addition numerically and graphically
• extrapolate a trend when given reasonable historical data.
Before tackling this activity, it would be helpful for the students to gain some understanding of how oil slicks
behave. Some of the websites that could be of great value within the classroom are:
• New Zealand Maritime Safety Authority: Managing an oil spill http://www.maritimenz.govt.nz/Publications-and-forms/Environmental-protection/Responding-to-an-oil-spill.pdf
• US Environmental Protection Agency http://www.epa.gov/oilspill/
• Environment Canada http://www.ec.gc.ca/ee-ue/default.asp?lang=En&n=88F67B04
Activity
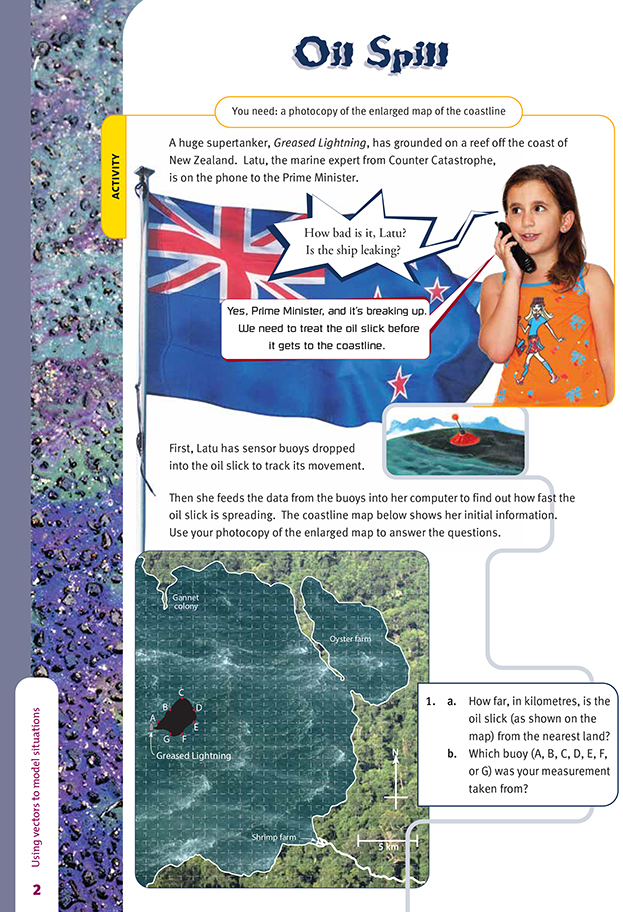
The buoys used to track the movement of the slick must be plotted on the map in order to understand the way the slick is moving. Each buoy moves a certain distance over a 24 hour period due to ocean currents and winds. The forces acting on the buoys will be acting on the oil slick as well. The change in position of each buoy during a day is called a translation. Vectors with two components (west-east and north-south) are the ideal mathematical tool for describing the movement of each buoy.
Vectors describe a translation:
The buoy at position (3,4) is translated to position (7,8) when the vector ![]() has acted on it.
has acted on it.
The top number in the vector is often known as the x component and describes horizontal movement east (+) or west (–). The bottom number is the y component and describes vertical movement north (+) or south (–). Whether the number is at the top or bottom of the vector and whether it is positive or negative
are both critical details, and order does matter! The students need to learn that they should not put a dividing bar between the top and bottom components as they would in a fraction because the two numbers are separate.
A value of 4 in the top number means the buoy moves 4 kilometres towards the east. However, –4 means that the buoy is travelling 4 kilometres in the opposite direction to east, which is west. Similarly, if the bottom number of the vector is negative, the buoy is travelling south, not north. It would be a good idea for the students to examine a number line and refresh their memories as to how the positive and negative signs affect direction of movement along the number line.
In this activity, the vectors describe the movements of each buoy during 1 day. If we examine just one of these buoys, for example, D, over 3 days, we have the following:
So the movement of buoy D over a 3 day period is described by applying the vector ![]() three times. Note that the start point for each translation is the end point of the previous translation. For the students to predict the movement of the slick, they will need to apply the given vectors to the buoys, each application representing
three times. Note that the start point for each translation is the end point of the previous translation. For the students to predict the movement of the slick, they will need to apply the given vectors to the buoys, each application representing
the movement for 1 day. The best strategy is to draw the location of all buoys at the end of day 1 and then draw in the outline of the slick. Repeat this for days 2 and 3.
Notice that the translation of buoy D for the entire 3 day period can be described by the vector ![]() , which is the same as
, which is the same as ![]() .
.
This shows that vectors can be added by adding together the top numbers and then the bottom numbers of each vector. The result is known as the resultant vector.
As an extension activity, the students could consider the problem in a little more detail. It is unlikely that the ocean current and the wind will be travelling in exactly the same direction at the same speed. Suppose the movement of buoy D over 1 day due to the current is described by the vector ![]() and the wind by the vector
and the wind by the vector ![]() .
.
Where will the buoy move to in 1 day? Adding the vectors gives ![]() .
.
The following diagram shows the combined effect of the wind and the current on buoy D:
Note that, on a diagram, vectors are added by joining the “tail” of the second vector to the “head” of the first vector. When two vectors are added, the resultant vector is marked with two arrowheads and the three vectors form a triangle. Note also that whether you add wind to current or current to wind, you get the same outcome.
A further extension task would be to remodel this situation as follows:
Take the original vectors given in the activity as the daily translations operating on each buoy due to ocean currents. Then suppose a constant wind blows across the bay, described by the vector ![]() . Which buoy will reach the coast first? Will Latu now be able to prevent disaster striking?
. Which buoy will reach the coast first? Will Latu now be able to prevent disaster striking?
Hint: The daily resultant vector for buoy D would be ![]() . Find the resultant daily vectors for each of the remaining buoys and then re-plot the movement of the slick using these new vectors.
. Find the resultant daily vectors for each of the remaining buoys and then re-plot the movement of the slick using these new vectors.
Cross-curricular links
Social Studies
The students could imagine that they are reporters who have arrived at the scene of an oil spill that has just occurred. They need to design questions to ask someone who is responsible for the supertanker to determine what their priorities are. They also need to design questions for an interview with a member of a conservation
group who is concerned about the effects the oil spill will have on the environment. The interviews should consider what resources are available within New Zealand to minimise the disaster.
Achievement Objective
• demonstrate knowledge and understandings of how and why people view and use resources differently and the consequences of this (Resources and Economic Activities, level 4)
Science
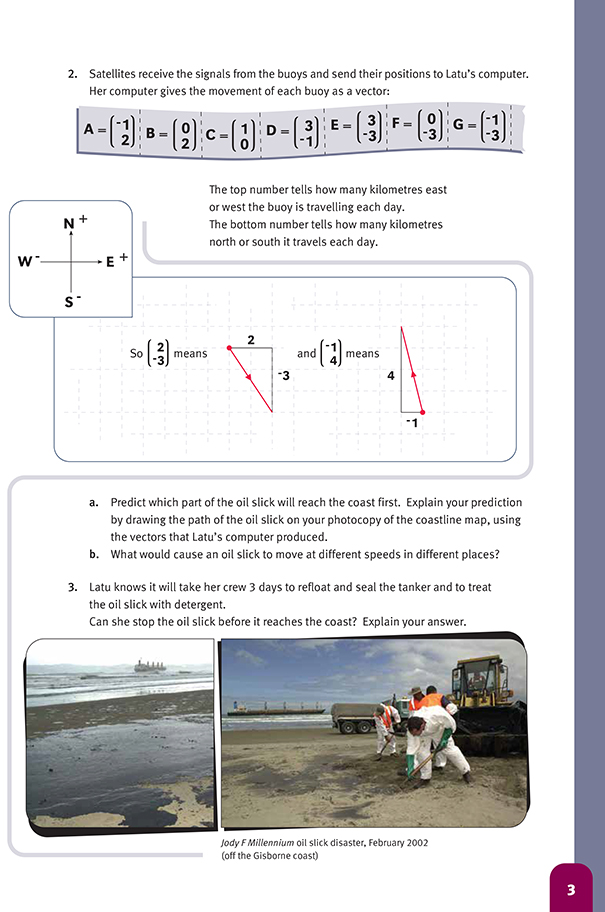
The students could investigate the chemical changes that occur when oil slicks are treated with detergent. They could also examine the effects of oil slicks on the environment.
Achievement Objectives
• investigate and describe ways of producing permanent or temporary changes in some familiar materials (Material World, level 4)
• investigate the positive and negative effects of substances on people and on the environment (Material World, level 4)
• investigate a local environmental issue and explain the reasons for the community’s involvement (Planet Earth and Beyond, level 4)
Answers to Activity
1. a. About 7.5 km from the gannet colony
b. It should have been taken from buoy C.
2. a. See the map on the next page. Parts of the oil slicks near buoy E and F will reach the coast first.
b. The effect of winds, tides, and ocean currents would cause the slick to move at different speeds in different places.
3. Yes, just. The oil slick will be close to the shrimp farm and other nearby parts of the coastline in 3 days, but it will not be right on the coastline, so the detergent treatment should stop it reaching the shrimp farm.