This is a level 3 statistics activity from the Figure It Out series.
A PDF of the student activity is included.
Click on the image to enlarge it. Click again to close. Download PDF (1560 KB)
sort data using a spreadsheet
draw conclusions from the data
compare conclusions with those made by classmates
This diagram shows the areas of Statistics involved in this activity.
The bottom half of the diagram represents the 5 stages of the PPDAC (Problem, Plan, Data, Analysis, Conclusion) statistics investigation cycle.
FIO, Levels 2-3, Statistics Revised Edition, My Town, pages 12-13
Classmates
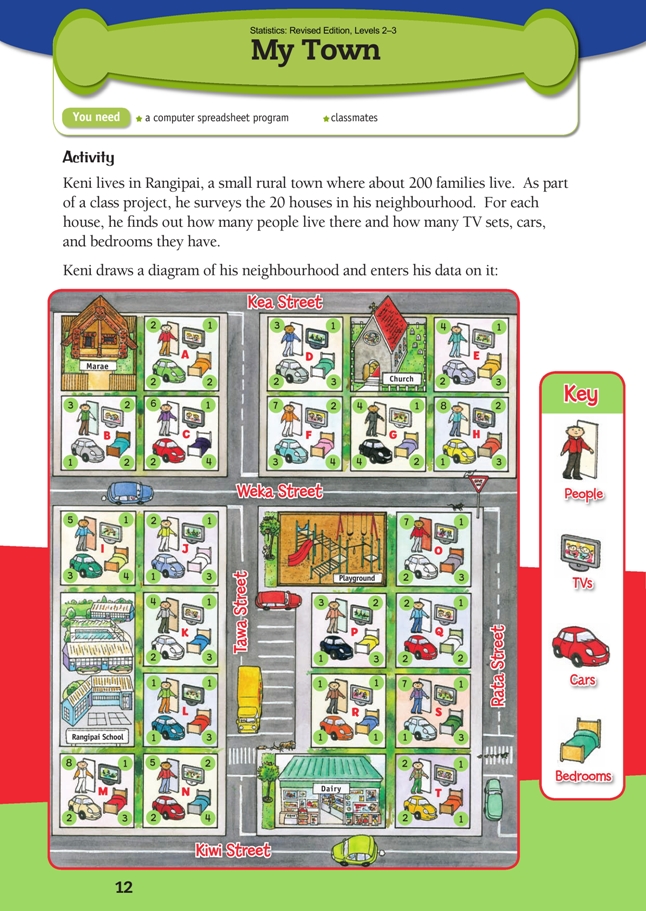
This self-contained activity revolves around the data depicted in the illustration on page 12 of the students’ book. Students process and explore it in different ways as they determine the answers to questions and the validity of statements.
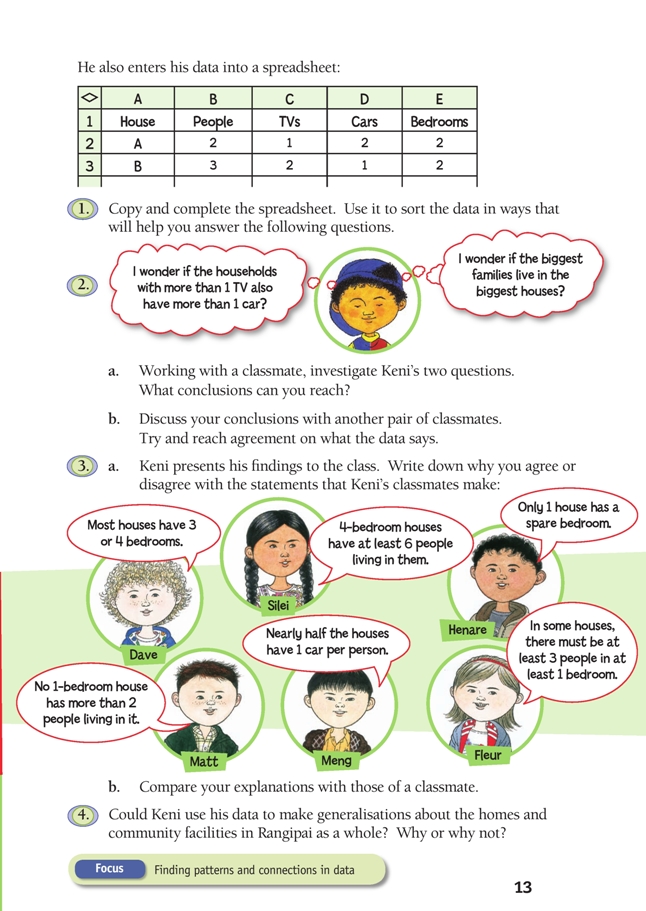
As a fi rst task, the students enter the data into a spreadsheet. This is to get it into a form that can be easily sorted and re-sorted in whatever order is most helpful for the purpose. For example, to answer Keni’s second “I wonder” question, it is helpful to sort the data fi rstly by number of people and secondly by number of bedrooms, using the Sort function:
The Answers show a table that has been sorted in this way. The grey bands group the lines according to household size.
An alternative method of sorting the data is to make a set of square data cards, one for each house, as in the example. Just as in the spreadsheet, the data cards can fi rst be sorted by one variable (for example, number of people) and then by a second. They can easily be re-sorted to answer other queries.
Note that the answer to Keni’s fi rst “I wonder” question is very straightforward. This is not true of his second question, where the answer can be either yes or no, depending on how the question is interpreted. This invites mathematical disputation.
The statements in question 3 are designed to get the students to explore the database in some detail, to decide what data supports or refutes each statement, and to think about the personal circumstances that the statistics purport to represent.
Question 4 asks about generalising from the data. This challenges the students to think about whether Keni’s data is likely to be representative of the whole town. If they think about their own community, town, or city, they are likely to realise that it is made up of different areas, each with its own distinct focus and character. They will realise also that amenities are spread around and that, just because there isn’t (for example) a movie theatre in their immediate neighbourhood, this doesn’t mean there isn’t one on the other side of town.
This entire activity is best done in pairs or small groups. In this way, students are able to have unsubstantiated statements challenged and learn to use data as the basis of argument. The students could be challenged to think of further “I wonder” questions or further statements, and to swap these with other students to answer or support/refute, using Keni’s data.
Answers to Activity
1.
In the spreadsheet below, the data has been sorted by number of people and bedrooms, using the Sort function. The bands of shading separate the data by number of people.
2. a.–b. The conclusion for Keni’s fi rst question should be “no”. There are only 5 houses that have more than 1 TV (B, F, H, N, and P). Of these, only 2 (less than half) have more than 1 car (F and N). Conclusions for Keni’s second question will
vary:
• If we assume that the houses with the most bedrooms are the “biggest” houses,
then the biggest houses on Keni’s map are the ones with 4 bedrooms. These houses
are all occupied by between 5 and 7 people. Families of this size are definitely
amongst the “biggest”.
• The two biggest families actually have 8 people in them, and both these families
are in 3-bedroom houses (I and N). By this measure, it is not true to say that “the
biggest families live in the biggest houses”.
• If we defi ne “biggest families” to be those with 5 or more people in them, half of
these families live in 3-bedroom houses and half live in 4-bedroom houses.
3. a. Dave: True. 14 out of the 20 houses have 3 or 4 bedrooms.
Silei: Not true. There are two 4-bedroom houses (I and N) that have
only 5 people living in them.
Henare: There is no way to be sure, but this statement is very unlikely to be true.
While there are only 2 houses that have more bedrooms than people (J and L),
there are other houses where 2 adults or 2 children probably share a bedroom,
leaving 1 bedroom spare.
Matt: True. There are only 2 houses with 1 bedroom (R and T); the first has
1 person in it, the second has 2.
Meng: Not true. Only 6 of the 20 houses (A, G, L, Q, R, and T) have 1 car per
person. This is not “nearly half”.
Fleur: True. 4 houses (H, M, O, and S) have 7 or 8 people living in them but only
3 bedrooms.
4. Keni should not try and make generalisations about the homes and community facilities (shops, library, churches, halls, and so on) in Rangipai as a whole, based on his data. The town has about 200 homes, and his data concerns only the 20 homes in his neighbourhood. We have no idea if, for example, there is a medical clinic in another part of town, or a library, hotel, or saleyard. We don’t know what shopping is available locally, or whether the better-off homes are near Keni or in another part of the town. We don’t know if the nearest big town is 10 or 100 km away.
Key Competencies
My Town can be used to develop these key competencies:
• thinking
• using language, symbols, and texts.