The purpose of this activity is to engage students in applying the skills of a statistical enquiry to make a business decision.
This activity assumes the students have experience in the following areas:
- Calculating sample statistics such as mean, median, and range.
- Recognising trends in time series data.
- Comparing distributions and patterns over time.
The problem is sufficiently open ended to allow the students freedom of choice in their approach. It may be scaffolded with guidance that leads to a solution, and/or the students might be given the opportunity to solve the problem independently.
The example responses at the end of the resource give an indication of the kind of response to expect from students who approach the problem in particular ways.
A roadside ‘coffee cart’ offers drinks and muffins for sale.
To make a healthy profit, they need to make just enough muffins to nearly sell out by the end of the day.
Use the sales figures for the past three months to suggest how many muffins they should make for a typical day.
Sales figures (XLSX, 12KB)
The following prompts illustrate how this activity can be structured around the phases of the Statistical Enquiry Cycle.
Problem
The problem section is about what data to collect and who to collect it from and why it’s important.
- What is my investigation question? Why do I wonder about that? (The question might be framed as “I wonder how many muffins the cart operators should bake each day?)
- What variables should the cart owners consider? (Students might acknowledge that total sales and months (time) are key variables but they might also separate weekdays and weekend days into two groups.)
- Is my question a summary, comparison, or relationship question? (The question involves a relationship between time and number of muffins sold.)
- Why is my question important? (The answer will affect the profitability of the cart and whether it can operate financially.)
Plan
The planning section is about how students will gather the data.
- How will I go about answering this question?
- What data will I need? Is all the data available?
- How will I organise and display the data to look for patterns and relationships?
- Will I need to calculate some statistics? Which statistics? How will those measures be useful?
- Can I predict possible answers to my question, even before I look at data? How?
- What might my answer look like? (Students should realise that they need to provide a recommended number of muffins, supported by evidence and an argument.)
Data
The data section is concerned with how the data is managed and organised.
- What format will I use to organise my data as I display it?
- What is the best way to look at trends over time? Why?
- What digital or written tools will help my organise my data? (Consider software for display, since the data are in a spreadsheet that can be imported into online software.)
- How will I protect the data I gather or retrieve so it is safe?
- Is some data ‘dirty’ (untrustworthy)? How will I clean my data?
Analysis
The analysis section is about exploring the data and reasoning with it.
- Have I reflected back on my question so I am clear what I am trying to find out?
- Do I get ideas about patterns, differences, relationships and trends from just ‘eyeballing’ the table of data?
- Are my important variables categoric, discrete numeric, or continuous (measurements)?
- How can I display different sortings of my data to look for patterns, differences, relationships and trends?
- What tools will help me to display the data in different ways? What ways are appropriate to my data and help answer my question?
- How might I describe the trends over time? What language might I use to describe what I see? Are there trends or the beginning of a seasonal pattern?
- Are there differences among statistics at different times in terms of centre, shape and spread? Which measures should I use?
- What variation can I see in my data? What might be the causes of that variation?
- Can I make preliminary statements about my findings, starting with “I noticed that...”
Conclusion
The conclusion section is about answering the question in the problem section and providing reasons based on their analysis.
- Have I answered my original question? If not, why not? (There should be a number of muffins per day recommended, possibly given for weekdays and weekends.)
- How might I convince someone else I have answered the question?
- What displays best show what I have found out? Explain why these displays are best.
- Is my summary of findings clearly written so others can understand it?
- Have I used displays and measures to support my ideas?
- Do I go back to the context to suggest why the relationships and trends occur?
- Do I say about the limitations of what I have found out? What can I say and what can’t I say?
- What strategies and tools proved the most useful in my inquiry?
- What other things have I learned and what further questions do I have?
Examples of work
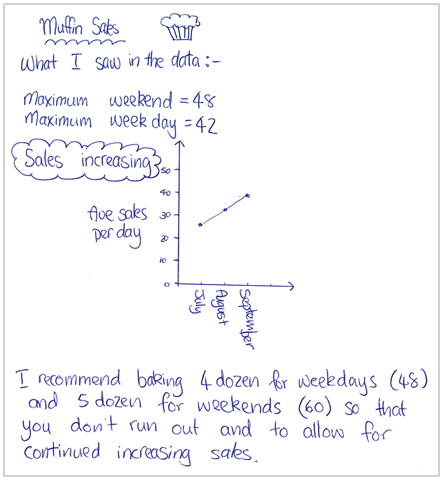
Work sample 1
The student calculates relevant sample statistics and considers trends in the time series data to make a judgement about the number of muffins to bake.
Click on the image to enlarge it. Click again to close. 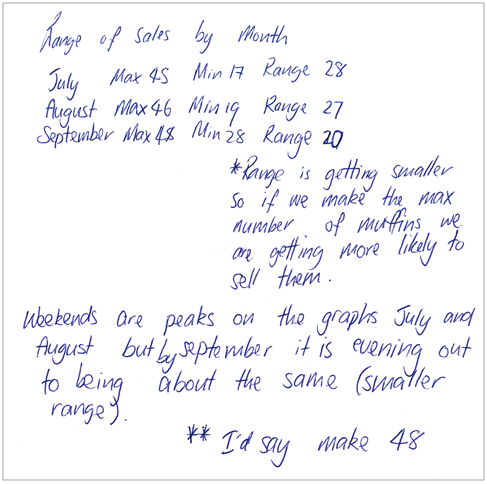
Work sample 2
The student uses a combination of calculating sample statistics, creating data display and considering trends on weekdays and on weekends, to make a judgement about how many muffins to bake.
Click on the image to enlarge it. Click again to close.