This is a level (2+ to 3+) mathematics in science contexts activity from the Figure It Out series.
A PDF of the student activity is included.
Click on the image to enlarge it. Click again to close. Download PDF (3238 KB)
Students will:
- use a protractor to measure angles
- interpret data displays and draw conclusions from graphs and tables
- investigate the relationship between season, latitude, and the angle of the Sun.
Students should discover that:
- daylight hours are a function of latitude – the lower the latitude, the lower the angle of the Sun and the bigger the difference between winter and summer
- temperature is a function of the angle of the Sun – the higher the angle of the Sun, the warmer the climate.
classmates
a protractor
an anemometer
a thermometer
site readings and graphs (see copymaster)
FIO, Sustainability, Levels 2+-3+, Location, Location ..., pages 12 - 15
Activity One
Preparation and points to note
Instructions for making an anemometer can be found on page 77 of Making Better Sense of Planet Earth and Beyond or in Chilling Out, Measurement: Book Two, Figure It Out, level 4+.
As with any group activity, carefully consider the needs of individual students when grouping. It can be a good strategy to give group members specific roles, such as recorder, measurer, or map maker. All members in a group need to participate fully in brainstorming, scouting sites, and evaluating.
There may be no site that is clearly the best. Encourage the students to question the evidence and to
determine which of the criteria are most important. Group decisions require co-operation, participation, and the ability to listen, so the key competency participating and contributing is a very suitable focus for this activity.
Points of entry: Mathematics
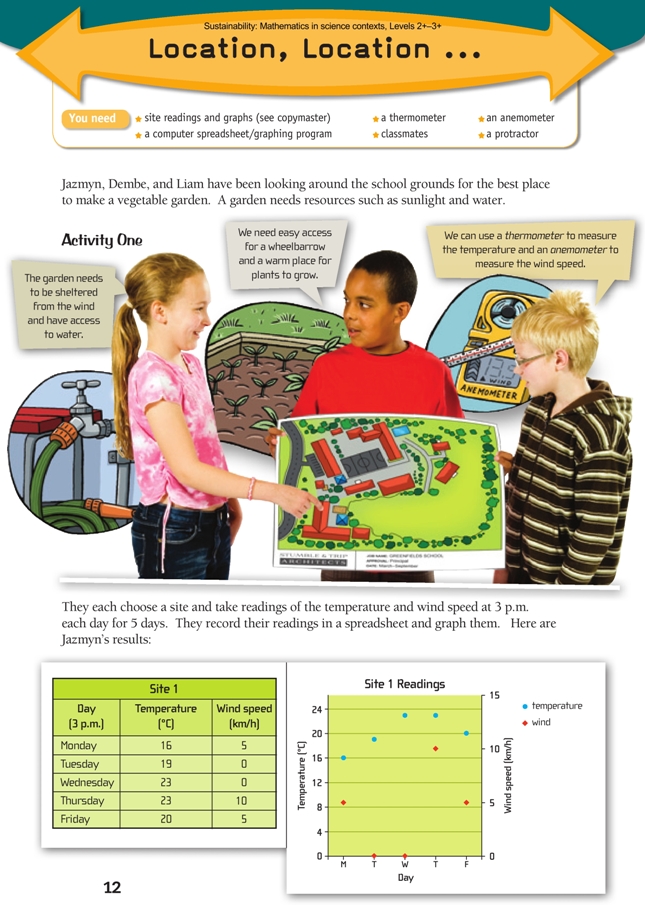
The graphs in the students’ book and on the copymaster use 2 vertical scales simultaneously: temperature on the left and wind speed on the right. It is likely that your students have not encountered this feature before. Ask them to think about why Jazmyn and her friends might have chosen to represent their data in this way. What stories do the graphs tell? What comparisons do they allow you to make? (Is one site always hotter?) What patterns do they help you spot? (Is there a relationship between temperature and wind speed?) Are the graphs easier to read than the tables that contain the same data?
Prompt the students to interpret the data in a real-world context: What was the weather at each site on a particular day? (For example, on the third day, site 1 was warm and relatively calm and on the fourth day, warm and windy. Site 1 is the warmest of all the sites, so it is probably gets the most sun and shelter.
The students need to realise that while they can compare the temperature (at 3 p.m.) across the 5 days, they can’t compare temperature and wind speed. For example, it is meaningless to say “The wind speed is always lower than the temperature.” There is no mathematical or scientifi c connection between the two vertical scales; they have been separately selected for convenience.
Some students may wonder why the data values for the 5 days are not joined with line segments to better show the trends. This is not normally done for spot readings because there may be major fl uctuations – in this case, in temperature and wind speed – between readings.
The students should consider the timing and frequency of their measurements: Is one set of measurements taken at 3 p.m. enough to give us a true picture? This raises the issue of sampling. They can’t be out there monitoring their sites all day (and night), so they need to consider what is the best compromise between a complete data set and manageability. You could challenge them with other examples of data gathering in which sampling is used.
Any activity like this that involves measurement should include discussion on sources of measurement error and variation: no measurement is ever 100% accurate, so what matters is that it is accurate enough for the purpose for which it is made. Ask the students how they could calibrate the anemometer.
Points of entry: Science
For question 1, the students should think about the environment at each site and the types of plants the students in the activity might grow. Ask What data is missing? (The activity mentions access to water, but the three students gather data only on wind and maximum temperature.)
Challenge your students: What assumptions have you made? Will the hottest site be the best site for plants?
Answers
Activity One
1. a. i. Jazmyn’s site has the highest average temperature; Dembe’s is the coolest.
ii. Liam’s site has the least wind.
iii. The best site will depend on what type of plants the students wish to grow. Because Jazmyn’s site is warm and relatively wind-free, it is likely to be the best choice for most plants.
b. Other factors might include type of soil, access to water, access for wheelbarrows, and security.
2. Practical activity. Graphs and choice of sites and will vary.
3. Evaluations and decisions will vary but should be clearly based on the evidence that you have gathered.
Activities Two and Three
Preparation and points to note
If your students are not familiar with angle measurement (a curriculum level 3 concept), start with the
notions of quarter and half turns and create the need for a method of describing turn that allows for finer discrimination. If they know the terms 360º turn, turn 180º, or 90º angle, these can provide a bridge to a more comprehensive understanding of how angle is measured and described. Once they have accepted that a one-quarter turn is 90º, draw a variety of angles less than and greater than 90º and challenge your students to estimate their size. The classroom door is a handy tool for illustrating turn.
Like anything else to be measured, angle requires a device with a scale: in this case, a protractor. Like a ruler, a protractor has a linear scale (one that is divided into equal, numbered units). The only complication – one that can confuse students – is that the scale on a protractor is numbered from both ends (0→180, or clockwise, and 180→0, or anticlockwise). To avoid problems, they should estimate the size of an angle before measuring it. When they know what they are looking for, they will fi nd that only one of the two alternatives on the protractor can possibly be the right one.
Challenge your students to explain why a ruler marked in centimetres (cm) is not a suitable means of
measuring turn/angle. Ask Why not simply say “The door is open 20 cm”? (Only the points on the outer edge have moved 20 cm. Points in the middle have moved 10 cm, and points on the inner edge have moved just millimetres. When we say “the door is open 20 cm”, our focus is the gap, not the turn.)
[Note for teachers. The words “angle” and “turn” mean the same thing, but the latter is used only when the context involves movement.]
These activities require students to interpret and work with unfamiliar kinds of diagrams; as such, they provide opportunity for a focus on the key competency using language, symbols, and texts.
Points of entry: Mathematics
Angle is fundamental to geometry. Ask the students to think of familiar contexts where angle is important. For example, How does the angle of a skateboard ramp affect your acceleration? At what angle will a kicked ball travel the furthest (45º)? How can the angle of the Sun be a problem for the driver of a car?
What matters most is that your students begin to get a conceptual understanding of angle. Understanding that a 70º angle is much greater than a 30º angle (and, therefore, that the Sun at 70º will be much higher in the sky) is more important than being able to identify or draw the difference between 35º and 39º.
Answers
Activity Two
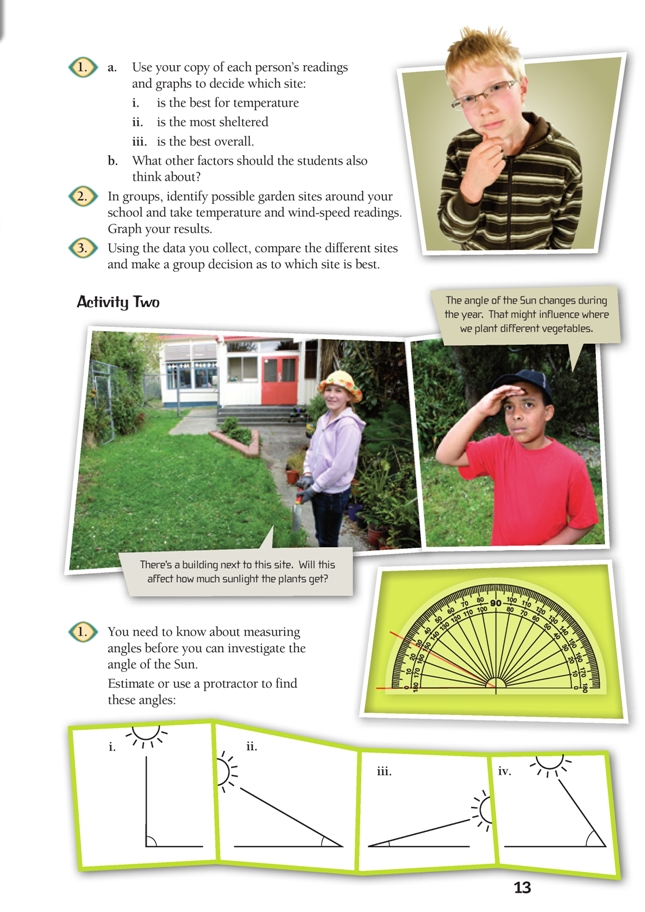
1. i. 90º
ii. 30º
iii. 15º
iv. 55º.
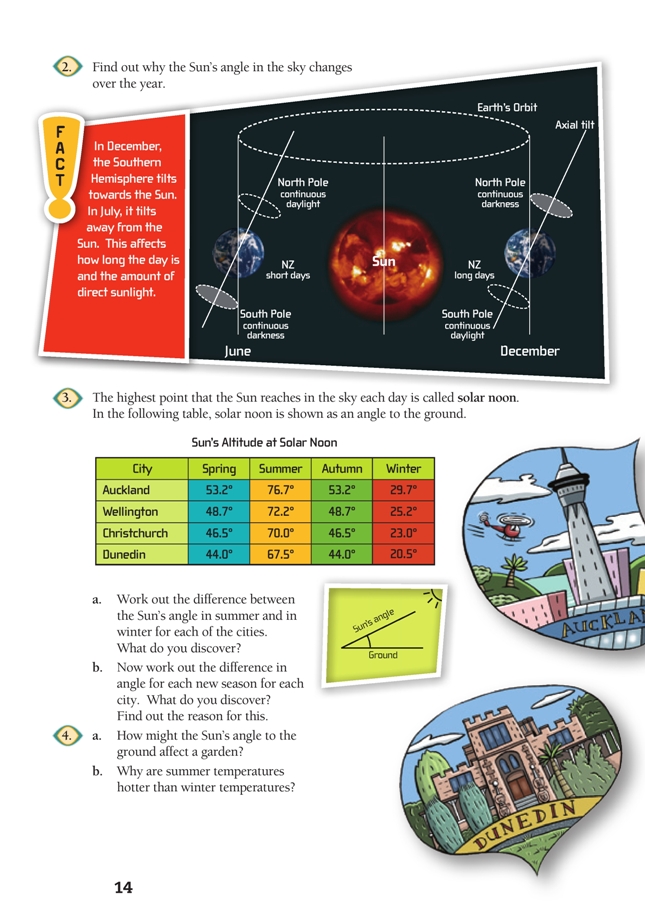
2. Earth is tilted in relation to the Sun. In winter, the Southern Hemisphere is angled away from the Sun. In autumn and spring, the axial tilt is sideways to the Sun, so the solar angle is not affected by the tilt. In summer, the Southern Hemisphere is angled towards the Sun.
The Sun is highest in the sky in the summer and at its lowest angle in winter, like this:
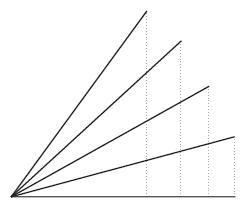
3. a. Auckland: 47º; Wellington: 47º; Christchurch: 47º; Dunedin: 47º. They are all 47º!
b. All the angles between summer, autumn, winter, and spring for each city are 23.5º (which is half of 47º). The reason is that Earth is tilted 23.5º.
4. a. When the Sun is higher in the sky, its energy is more intense because it shines more directly on the ground. (Its rays take a more direct route through the atmosphere, and the light and heat produced are more concentrated.)
b. In the summer, the Sun’s high angle means that the days last longer (the Sun shines on us for more time, and the heat from it is more concentrated), so the ground is heated for a larger part of the day and the temperatures are hotter.
5. a. The points for each city are at different heights because the cities are at different latitudes.
The figures for the Sun’s altitude at solar noon are highest for Auckland because it is the most northern of New Zealand’s cities; the figures are slightly lower as you move south. The latitudes for the four cities are:
| Auckland | 36.8˚ south |
| Wellington | 41.3˚ south |
| Christchurch | 43.5˚ south |
| Dunedin | 46˚ south |
b. You might notice that:
- the pattern repeats (this happens because Earth goes around the Sun following nearly the same path every year)
- the Sun’s angle to the ground is the same for spring and autumn
- the path of each line is parallel to the paths of other cities.
Activity Three
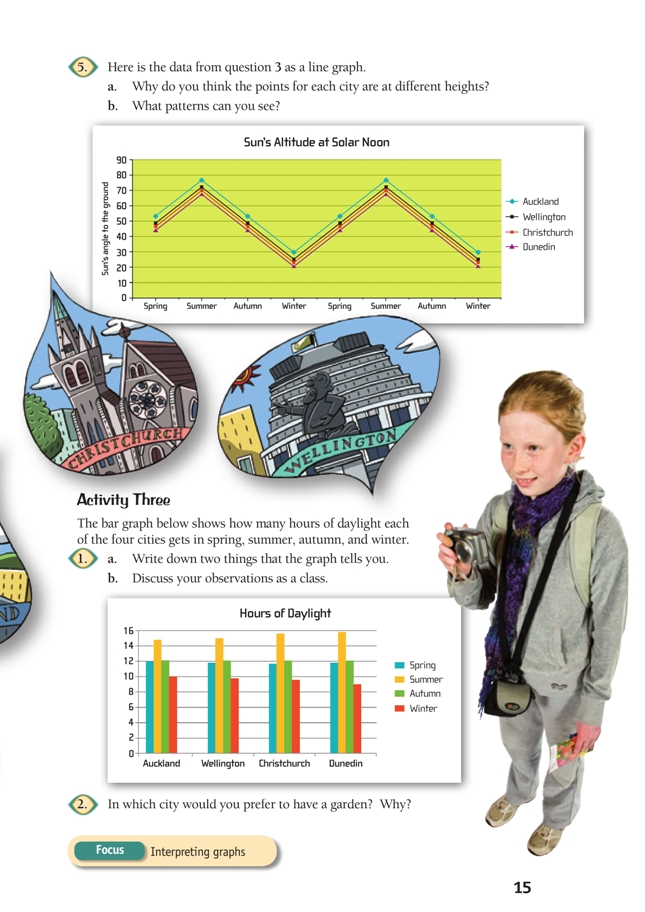
1. a.–b. Answers and discussion will vary. Points you might notice include:
- All four cities follow the same pattern, and differences between the cities are not particularly large (because the spread in latitudes is not great).
- Dunedin gets the most summer daylight hours (this might surprise you) and the lowest winter daylight hours.
- The further south you go, the greater the difference between summer and winter.
2. There is no correct answer. Tropical plants that require warm temperatures and a lot of sunlight will grow better in Auckland. Pines and other cold-climate plants will grow better in Dunedin. Many vegetables need a period of cold temperatures. Make sure that whatever city you choose, you have evidence to back up your selection!