The purpose of this activity is to engage students in discussion, evaluating the effectiveness of data displays in presenting the findings of a statistical investigation.
This activity assumes the students have experience in the following areas:
- Displaying category and number data in appropriate ways.
- Interpreting bar graphs and pie charts.
- Connecting patterns and differences in bar charts and pie charts to situations.
- Communicating findings from data displays.
The problem is sufficiently open ended to allow the students freedom of choice in their approach. It may be scaffolded with guidance that leads to a solution, and/or the students might be given the opportunity to solve the problem independently.
The example responses at the end of the resource give an indication of the kind of response to expect from students who approach the problem in particular ways.
A year 6 class investigated how people listen to music with the following question:
Which way do you usually listen to music?
They grouped their data and set it out on the table below:
| Year 6 | Older siblings | Student Teachers | Teachers | Parents | |
| Radio | 2 | 6 | 0 | 7 | 12 |
| Streaming | 18 | 8 | 4 | 0 | 0 |
| Downloaded | 0 | 2 | 1 | 3 | 8 |
| CDs | 2 | 0 | 1 | 5 | 9 |
| Live | 0 | 0 | 1 | 0 | 0 |
| Mixture | 4 | 3 | 1 | 2 | 10 |
| Other | 0 | 0 | 0 | 0 | 0 |
When they analysed the data, they came up with the following conclusions:
- Older people (parents and teachers) listen to the radio or their own CDs, itunes, etc.
- Younger people prefer the internet.
Discuss the effectiveness of the data table in leading to their conclusions.
The following prompts illustrate how this activity can be structured around the Analysis and Conclusion parts of the Statistical Enquiry Cycle
Analysis
The analysis section is about exploring the data and reasoning with it.
- What is the enquiry question?
- Have I reflected back on my question so I am clear about why the table was created?
- Do I get ideas about patterns, differences, relationships and trends from just ‘eyeballing’ the table of data?
- Are the important variables categoric, discrete numeric, or continuous (measurements)?
- Could the data be displayed in better ways? How? Why?
- What tools will help me to display the data in different ways? What ways are appropriate to the data and help answer the question?
- What variation can I see in the data? What might be the causes of that variation? (One type of variation is differences in preferred listening setup by age of person type.)
- Can I make preliminary statements about the findings, starting with “I noticed that...”
Conclusion
The conclusion section is about answering the question in the problem section and providing reasons based on their analysis.
- Have I answered the original question? If not, why not?
- How might I convince someone else I have answered the question?
- What were the strengths and weaknesses of the table as a data display?
- Is my summary of findings clearly written so others can understand it?
- Have I used the table display and measures to support my ideas?
- Do I say about the limitations of what I have found out? What can I say and what can’t I say?
Examples of work
Work sample 1
The student looks for similarities and differences among age groups. They compare groups using totals and fraction.
Click on the image to enlarge it. Click again to close. 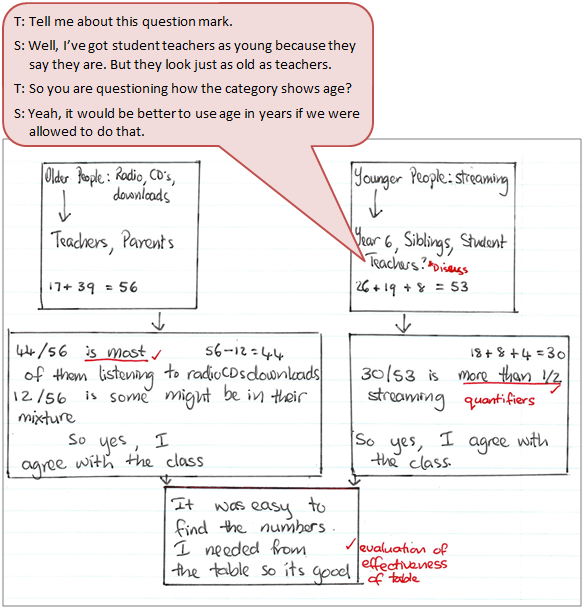
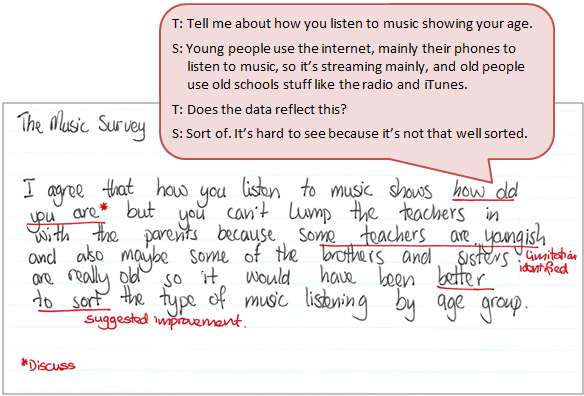
Work sample 2
The student evaluates the effectiveness of the table of data in supporting pattern and difference finding among groups. They note limitations and suggest improvements.
Click on the image to enlarge it. Click again to close.