This is a level 3 activity from the Figure It Out series.
A PDF of the student activity is included.
Click on the image to enlarge it. Click again to close. Download PDF (539 KB)
Timelines are a useful way to display information. They are often used in social science contexts. They show the order in which events occurred and the periods of time between them. Timelines need to follow conventions used in other data displays, in particular, they must have a uniform scale and clear labels.
a ruler
classmates
In these activities, students create timelines and work with dates.
Constructing a timeline involves more than simply placing years in the correct order. The students need to see a timeline as a number scale, with uniform spacing between consecutive years. Ask your students to create their timelines before you discuss with them the conventions that they should follow. This will provide you with valuable information about their prior knowledge. Have them discuss their timelines and explain the methods they used to create them. Discuss useful units (months, years, or decades).
- What year should the timeline start at? Why doesn’t it need to start at 0?
- What scale did the students use (if any)? How did they decide how long to make the timeline? How did they work out the width for each year?
One way to decide on a useful scale for the timeline is to work out how many years it needs to cover. For example, Colin Murdoch was born in 1929 and died in 2008. 2008 – 1929 = 79 years ≈ 80 years. If a timeline is 240 mm long (a length chosen because it is a multiple of 80), then each year will be represented by 3 mm. If A3-sized paper is used, the timeline could be 40 cm long, with each year represented by 0.5 cm (5 mm).
Timelines can be used to reinforce understanding of place value. Consider making a large timeline for the classroom wall, marking the years between each decade. If the scale is large enough, the students can be asked to approximate where July or December would be in a given year and position their birth date on the line. Point out that, unlike a counting number line, this involves dividing each year into 12 small units rather than 10.
The game Squeeze – Guess My Number (NDP Book 4: Teaching Number Knowledge, page 15) can be adapted for this level and context by playing “Squeeze – guess my date!” Give the students a number line from 0 to 2010 (or the current year). For each date guessed, a classmate says “later” or “earlier” until the correct date is found.
Take care when using online timeline makers; many of these pay no attention to scale and simply place events in chronological order.
The context in Activity Two provides an opportunity for developing number strategies.
Creating visual representations of text information helps develop the key competency using language, symbols and texts.
Technology-related student activities
- Consider Ingrid’s list, or any other inventions, and suggest how they changed people’s lives. Another way of looking at this is to imagine life without a particular invention or technology.
- Choose one invention and imagine what prompted the inventor to make it. Research the invention to see whether this was the case.
- Design a solution for a common need.
- Make a table of inventions and suggest the types of people who rely on them. For example:
Invention or technology Needed by Electric fence Farmers, people wanting security ... Sunglasses Pilots, skiers, drivers ...
Exploring the technology-related context
Some technological innovations have resulted from “know how”. Sometimes creative leaps have been made from opportune discoveries. Others have been developed over long periods of laborious trialling. Many breakthroughs are inspired by need, but others that start off as a luxury soon become a necessity.
New Zealanders have produced many technological innovations. Māori developed effective food production and storage systems, early pioneers invented agricultural mechanisms, and modern Kiwi technologists are well represented in a number of high-tech fields.
Answers
Activity One
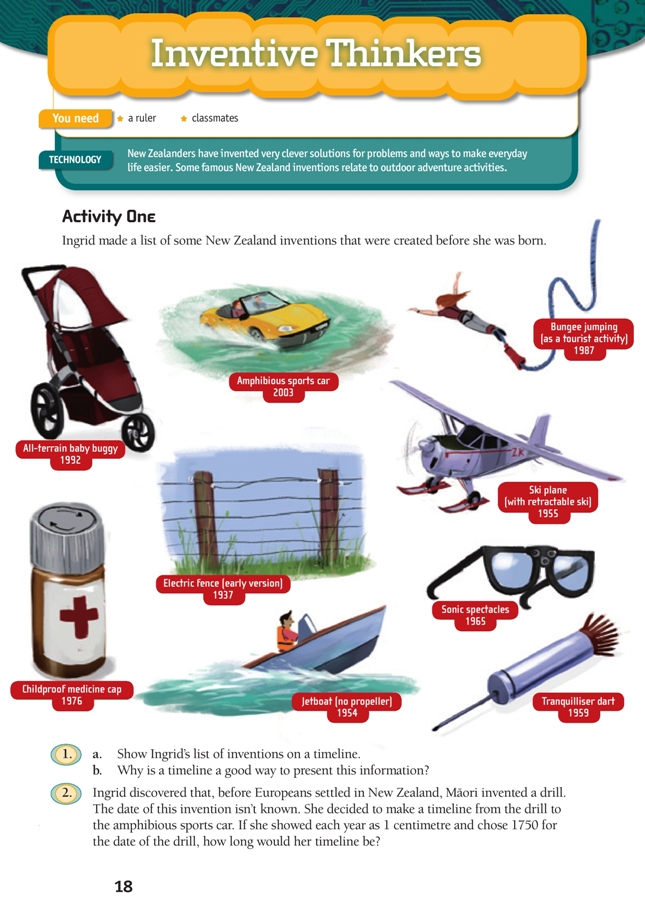
1. a. The objects on your timeline should be in this order: 1937 (electric fence); 1954 (jet boat); 1955 (ski plane); 1959 (tranquilliser dart); 1965 (sonic spectacles); 1976 (childproof medicine cap); 1992 (all-terrain pushchair).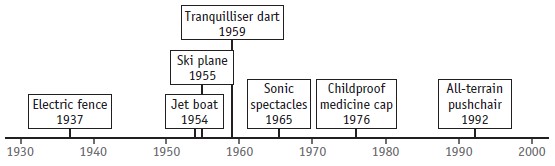
b. A timeline places the inventions in the order they were created.
2. 242 cm (2.42 m) because the inventions are 242 years apart (1992 – 1750 = 242)
Activity Two
1. Your timeline should look like this: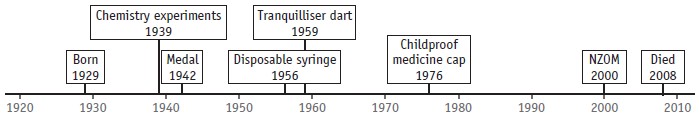
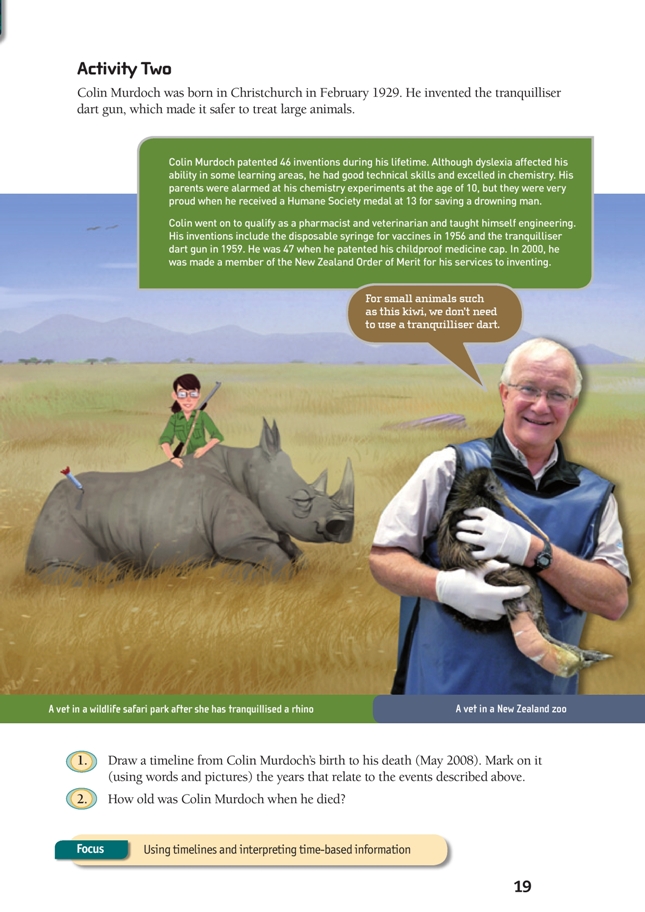
2. 79 (2008 – 1929 and May is after his birthday in February.)