This is a level (3+ to 4+) mathematics in science contexts activity from the Figure It Out series.
A PDF of the student activity is included.
Click on the image to enlarge it. Click again to close. Download PDF (1571 KB)
Students will:
- measure and record data relating to two variables (the dependent variable is the mass of an ice cube; the independent variable is the type of clothing)
- use data to decide which clothing will best guard against hypothermia when tramping.
Students should discover that:
- they can use experimental models and results to draw conclusions about real (tramping) scenarios.
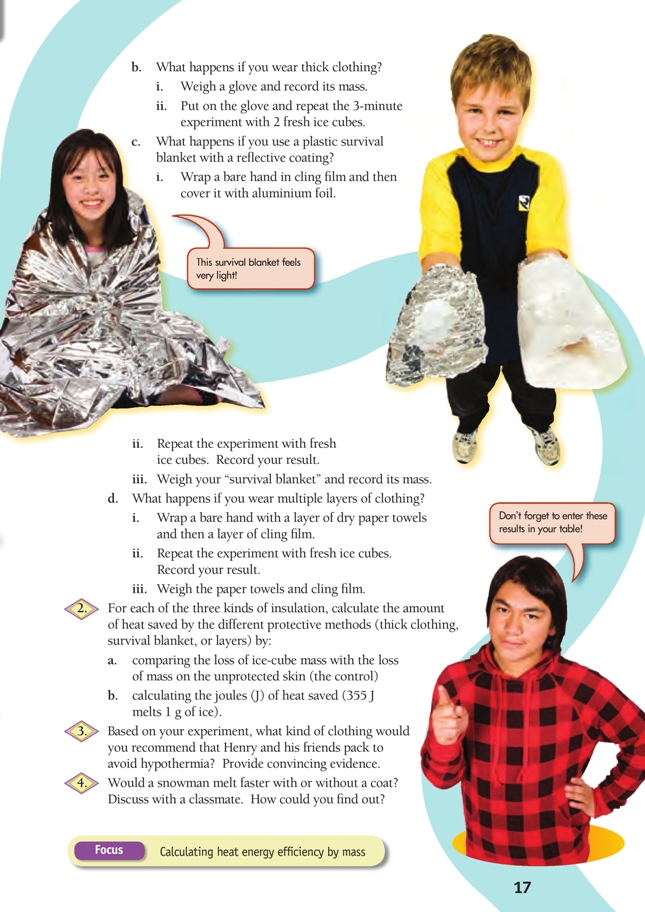
cling film
a glove (for example, a wool glove or ski mitten)
paper towels
a timer or watch
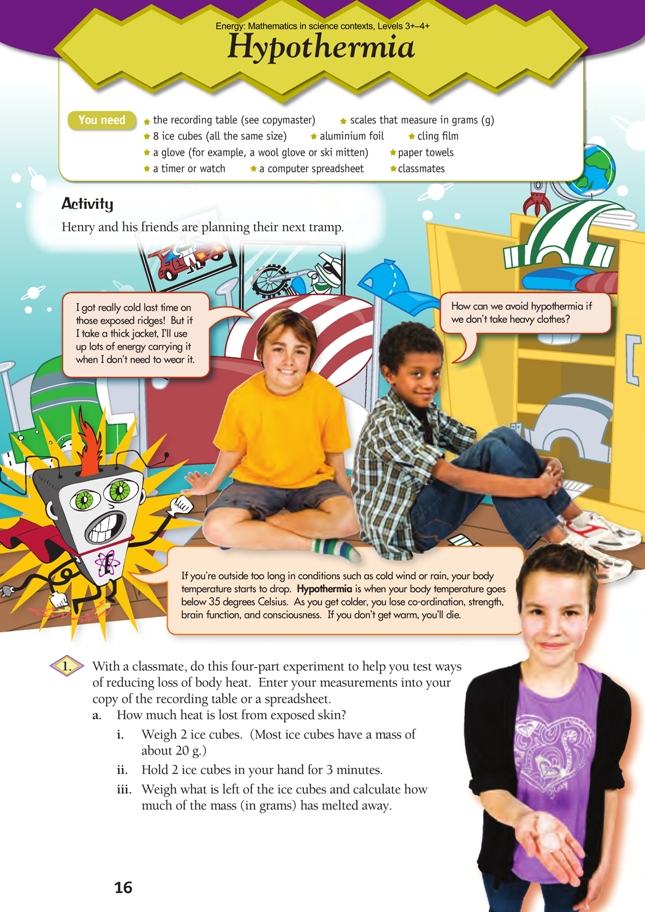
8 ice cubes (all the same size)
scales that measure in grams (g)
the recording table (see copymaster)
a computer spreadsheet
classmates
FIO, Energy, Levels 3+-4+, Hypothermia, pages 16 - 17
Preparation and points to note
You will need enough similar-sized ice cubes for multiple trials for all groups. Melting ice cubes create a lot of water – establish expectations for handling and cleaning up.
Holding ice for a prolonged period can be painful; modify the time period if necessary. If students do this, they should ensure that they use the same period for subsequent trials (fair testing).
To get the most out of this investigation, the students will need to work co-operatively, initially in pairs. This gives them an opportunity to develop the key competency participating and contributing.
Points of Entry: Mathematics
This investigation is a controlled experiment to measure the insulating effect (reduction in energy* loss) of different types of “clothing”.
Encourage the students to apply each stage of the statistical enquiry cycle: problem, plan, data, analysis, and conclusion. Before they start testing, ask them to predict which clothing type will perform best. They should also think about potential sources of error and how they can be controlled. For example, they will need to use cubes with a similar mass and let their hands warm up again before they start the next trial. Prompt them to think about whether they should use multiple trials or average the data from several groups, or both. (Different hands will transfer different amounts of heat, so a class average will tend to smooth out variation.)
Make sure the students draw appropriate conclusions from the data, for example, Which is better, less melting or more melting? (Less melting means better clothing because less heat was transferred from the hand to the ice.) Remind the students that there are two variables (mass and type of clothing) and encourage them to use all of the evidence to make their decision. For example, the heavy glove may reduce heat transfer the most, but it might not be as efficient as a smaller mass of layered clothing. In other words, you could get as much insulation with less mass by using layers or a survival blanket instead of a bulky glove.
At the end of the investigation, the students will have 4 pieces of data. Using the table provided (see
copymaster) will help them to structure their comparisons. They need to compare the amount of energy saved (energy not transferred to the ice compared with energy transferred from bare hands) with the amount of energy transferred. A suitable way of comparing the three “clothing” types is to divide the joules saved by the mass. This gives the energy saved per gram for each type. A sample table is listed in the answers.
You could ask the students to pool their data and average it. They could then present their findings
graphically.
Points of Entry: Science
At the end of this activity, the students should be able to identify clothing types that are suitable for tramping (high in insulating effect, low in mass). Ensure that you have enough time for a closing session so that all students are clear about what makes an item good for preventing hypothermia. Encourage discussion of ideas and findings: groups may get different results, especially if each group uses different types of gloves and different amounts of foil, plastic, and paper. What matters is that they can (begin to) identify the reasons for the different results.
Some lighter materials, such as those used in expensive ski gloves, offer better insulation than thick woollen ones, so the students need to consider thickness as well as type. Modern polypropylenes are good examples of light, very effective insulators. The order and composition of layers also matters. For example, paper over plastic will not be as effective as plastic over paper because the air gap between the plastic and the paper provides some insulation while paper on the outside will get wet and mould to the plastic, squeezing out almost all air. Encourage the students to think about the “ideal” glove, for example, a medium-weight glove made with multiple layers of waterproof material, reflective material, and cloth insulation. You may be able to cut open a real ski glove and show that it is constructed from a number of different fabrics.
Make sure that the students can transfer the results of their experiments to other contexts, such as the snowman (question 4). Insulating materials slow the transfer of heat energy, so a snowman with a coat will melt (absorb heat energy) more slowly than a snowman without a coat. Similarly, a well-insulated house will heat up more slowly on a hot day.
Reinforce use of the scientific inquiry method. Ask: What are the variables? What does it mean to do a controlled experiment? Why do the bare-hand test? (Only when we know how much energy is lost when no clothing is worn can we determine the effectiveness of different materials.) The students should try and control as many of the extraneous variables as possible, for example, ice cube size (keep the same), time of tests (keep the same), hand(s) (use the same person and make sure that the hand is dry and about the same temperature at the start of each test).
In conclusion, ask What further investigation could you carry out to show which type of clothing is most suitable for a tramp? Invite students to develop additional questions or hypotheses and then answer or test them.
Answers
1.–2. Practical activity. Answers will vary. A sample table is shown below.
To find the energy transferred, multiply the mass lost by 355 joules per gram [J/g]; to find the insulating effect, subtract the energy transferred for that clothing type from the energy transferred by a bare hand.
| Clothing type | 2 ice cubes, starting mass (g) | 2 ice cubes, final mass (g) | Mass lost (g) | Energy transferred (J) | Clothing mass (g) | Insulating effect (J) [energy from bare hands minus energy for this type], for question 2 | Energy savings by mass (insulating effect ÷ clothing mass) |
| Bare hand | 40 | 21 | 19 | 6 745 | 0 | 0 | 0 |
| Thick glove | 40 | 30 | 10 | 3 550 | 120 | 3 195 | 27 |
| Aluminium foil “survival blanket” | 39 | 33 | 6 | 2 130 | 30 | 4 615 | 154 |
| Plastic and paper layers | 40 | 32 | 8 | 2 840 | 25 | 3 905 | 156 |
3. Answers will depend on the actual data. For the sample data above, the plastic and paper layers
were the most efficient by mass, preventing the transfer of 156 J of heat energy per gram of mass.
Overall, the “survival blanket” insulated the most (4 615J), but its mass was greater than that of the
plastic and paper layers. The paper/plastic was more efficient per gram than the survival blanket,
even though the survival blanket was better overall.
4. The snowman without a coat will melt faster. The coat on the snowman acts as an insulator, in this case, reducing the transfer of heat from the outside air to the snowman, just as the “survival blanket” reduced the transfer of heat from your hand to the ice cube. To test this, wrap an ice cube in fabric and compare how quickly it melts with how quickly an unwrapped ice cube melts.