This unit requires students to look at the reported state of bullying in New Zealand schools and to develop and administer their own surveys about bullying. They analyse their data and create a report outlining the results of their investigation.
- Critically explore the validity of claims based on data.
- Evaluate the quality of survey questions that are developed by others.
- Create survey questions that align to an investigative question.
- Administer a survey, collate, and display the data, and report findings.
This unit addresses both statistical investigations and statistical literacy. Statistical literacy is about critically examining claims made by others, that are based on data that has been gathered or accessed. Critique includes verifying the identification of important variables, sampling, the method of analysing the data, unbiased display of results, and most importantly, whether the data answers the investigative question, given uncertainty.
Statistical enquiry involves investigating a topic or area of interest, that involves an aspect of “I wonder”. The PPDAC cycle is an established part of the New Zealand Curriculum and is applied in this unit.
- Problem – Generating ideas for statistical investigation and developing investigative questions
- Plan – Planning to collect data to answer our investigative question
- Data – Collecting and organising data
- Analysis – Creating and describing data displays to answer the investigative question
- Conclusion – Answering the investigative question and reporting findings.
Ethical practices
At the core of ethical practices in statistical enquiry is the need to do good and to do no harm. Key practices include:
- obtaining informed and voluntary consent from participants
- minimising the risk of harm to participants
- respecting participant’s right to withdraw at any time without giving a reason
- respecting and protecting participants’ privacy and confidentiality
- avoiding any unnecessary deception to participants
- being socially and culturally sensitive to participants’ cultural and religious perspectives.
Interrogating survey questions
A guide to good survey design is a good resource to help with checking survey questions. See section 8.6 List of pitfalls to guard against and check for.
Interrogating statements made by others about statistical investigations
Prompts include:
- Do the statements about the displays accurately reflect what the displays are showing?
- Do the statements about statistics accurately reflect any statistics given?
- Do the statements contain contextual information e.g. variable, values, units, group?
- Is there another analysis that could have been done?
- Could other variables have been considered?
- Are there different displays that could have been drawn?
The learning opportunities in this unit can be differentiated by providing or removing support to students and by varying the task requirements. Ways to support students include:
- constraining the complexity of the data collected; such as using a restricted set of category responses
- modelling the processes of posing questions, designing survey questions, analysing the results, and reporting the findings
- providing reading and writing support for students, as appropriate, possibly by pairing students with a more literate other
- providing pre-prepared graph templates to support developing scales for axes and access to digital graphing platforms
- providing prompts for writing survey questions, and descriptive statements for reporting.
The context for this unit can be adapted to suit the interests and experiences of your students. Bullying is a commonly discussed topic in the media and is of personal interest to students. However, other topics can also be engaging, such finding out people’s attitudes about climate change, availability of fireworks or daylight saving. Note that the statistical enquiry process can be applied to many topics and selecting ones that are of interest to your students should always be a priority. You might collect data to find out which topics most interest your students.
- Copymaster 1
- Copymaster 2
- Copymaster 3
- Copymaster 4
- Copymaster 5
- PowerPoint 1
- PowerPoint 2
- PowerPoint 3
- PowerPoint 4
- Use of technology, including survey tools and statistical analysis software is recommended
- Access to the internet
Lesson One: Exploring bullying statistics in New Zealand
In this unit students explore some statistics about bullying in New Zealand schools.
TIMSS 2014/15 and PISA 2015
- There are several online articles about bullying available if you want students to search for information. However, a very brief summary is provided in PowerPoint 1. Show the first three slides of the PowerPoint.
Stop after slide three and discuss these questions with your students:- Do the findings surprise you?
- Do the findings match your experience at school?
- Some students might perceive bullying to be only physical violence. Broaden the idea of bullying by asking:
What kinds of behaviours (things people do) might be bullying? - Make a list of bullying behaviours then look at Slide 4. Copymaster 1 is a bigger copy of the graph for students to use.
- Ask students to look at the graph and interrogate it. Get them to discuss the graph, in small groups, and record their thinking about how the data about bullying may have been gathered.
How did the people who created this graph gather their data? - Encourage the students to research online, a search for "TIMSS 2014/15" should lead to the Education Counts report. The Ministry of Education report He Whakaaro: What do we know about bullying behaviours in New Zealand? (Mhuru, 2021) contains TIMSS key facts which are useful to interrogate the data provided in the graph. Some interrogative questions to use to support student thinking are:
- Who was surveyed?
- Who did the surveying?
- When was the questionnaire completed?
- Who is the graph of? How do we know?
- What data is the graph showing?
- Which survey question was used to provide the data in the graph?
- Hint: look at year 5 student and year 9 student survey questionnaire for TIMSS
- For 15-year-olds use the 2018 PISA report (search for "PISA 2018 New Zealand students' wellbeing" to find the PDF document)
- Bullying information from PISA is in the wellbeing report from page 20 on.
- Rove around to see what students are thinking. Encourage them to be specific. In particular:
- Do they discuss asking a group (sample) of people?
- Who do they select? (School aged children at ages 9, 13 and 15 years)
- How many people do they select? (Sample size)
- What do they ask the people they select? (Specific response examples)
- Gather the class and discuss the points above. The sample sizes in TIMSS and PISA are very large, e.g. over 8,000 students in TIMSS 2014/15. You might ask what a practical sample size might be for a small study. Students might highlight that asking a small number of people may not give reliable results. Why not? (variability)
Why couldn’t we ask a very large number of people? (Only so many students in our school, too much time, hard to process all the data) - Once you have interrogated the graph and understand what data was collected, from who, and how it was collected, start to discuss the findings.
- Ask your students what they notice about the graph. Use the starter “I notice…” on the board and get students to work in small groups to notice everything they can. This may also require them to go back to the data source to see more about where the data came from.
Look for the following capabilities in your students:- Do they recognise that the triple bars refer to data from different age groups?
- Do they notice that the percentages of students reporting bullying are higher for younger students than older students? [Why might that be? – see page 28 of the PISA report]
- Do they notice that the length of specific bars provides a percentage?
- Can they read off specific percentages?
- Do they know what percentage means? (A rate of x in every hundred students)
- Can they classify the bullying behaviours? [e.g. physical, verbal, emotional, etc.]
- Do they notice that posting embarrassing things about me online is only for year 9 students, why? [year 9 questionnaire was the only one that asked about that]
- Why are there no 15-year olds in the “somebody shared embarrassing information about me” or “I was made to do things I didn’t want to do” categories? [these were not in the PISA questionnaire]
Extra bullying data to explore if needed for the lesson
If there is time in the lesson, the 2015 CensusAtSchool questionnaire had four questions on bullying. Data from these questions were shared with the media in the form of press releases. More recent questionnaires have not included questions on bullying. However, it could be worth looking at CensusAtSchool questionnaires for other data to use with your class.
On 12 June 2015 CensusAtSchool made a press release with the heading: Verbal abuse the biggest bullying problem at school: Students.
Subsequently Radio New Zealand, Maori Television, NZ Herald, and Stuff (twice) published their own articles based on the CensusAtSchool press release. See links to all articles here.
Students can read the original press release and then in groups pick one of the other press articles and compare the press articles with the original press release. Ask the students what they think they should compare. E.g. is the data used in the article the same as the press release, what additional reporting has been included, is it relevant to the topic?
Copymaster 2 has nine graphs made from a sample of 1000 students from the CensusAtSchool 2015 database. See if these graphs support the evidence in the original press release.
You can make your own graphs by downloading a sample from the CensusAtSchool data viewer. Agree to the conditions of use; in the plan section select the CensusAtSchool NZ 2015 database, for the total sample size put 1000. Then select get data. This results in the Analysis section coming up, and therefore the option for graphing. Select the variable(s) to investigate, then select "do analysis". Students can do additional analyses by repeating the process - select a variable, then select "do analysis". The graphs stack up on the screen.
Introducing the PROBLEM
Today we have explored existing data on bullying in New Zealand in preparation to undertake our own statistical investigations on bullying. This will be our topic to investigate. Over the next few lessons we will explore developing a questionnaire, collecting and analysing data and reporting our findings.
Lesson Two: Understanding survey questions
In this second lesson we will explore existing survey questions on bullying to help us to see the structure of survey questions and to consider good ethical practices for collecting data, especially for potentially sensitive topics. We will look at the different types of survey questions that might be asked.
- Show the students slides five to seven of PowerPoint 1. The survey questions shown are taken from publicly available surveys about bullying. For each survey question, ask students about what is found out from the survey question.
Why might the investigators want that information?
The main purpose is to extend students’ ideas about what might be asked about bullying, from establishing its occurrence (what, when and where), to finding out actions that students take, and ideas about how the situation might be improved, if it needs to be. - Copymaster 3 has the three slides on one page for students to answer. Hand out the sheet and ask students to think about their possible responses to the survey questions. They are not to answer the survey questions, just think about their possible responses. Once this is done, ask the students to discuss in their groups if any of the survey questions would be hard to answer, by themselves or by others, and why, and whether there are any issues with the wording of any of the survey questions. Groups to make notes to report back to the class.
Note for teachers: Students are not asked to complete this questionnaire on paper, in class, for ethical reasons. Two key ethical practices that potentially would be violated are:- minimising the risk of harm to participants
- respecting and protecting participants’ privacy and confidentiality
- Feedback may include:
- The ethnicity survey question requires a student to opt for one ethnicity when some may identify themselves with two or more ethnicities, e.g. The child of a Thai mother and Samoan father. This survey question assumes students will identify with only one ethnic group “the most”. This is not a good assumption.
- The open response survey question, about why no action was taken, might imply blame. That can lead to students not answering honestly. When people respond to survey questions either by providing incorrect information or by answering untruthfully this is called a response bias and is an example of a non-sampling error.
- Students may indicate that one or more of the survey questions made them feel uncomfortable or that they did not want to answer them. They probably will not want to explain why, but point out to them that when they get to develop their own survey questions they need to think about this when they write their own survey questions – they should ask themselves if others would feel comfortable answering the survey question.
CensusAtSchool 2015
The 2015 questionnaire for CensusAtSchool had four questions on bullying.
In preparation for completing the online questionnaire teachers were provided with a PowerPoint to support their students with the sensitive topic. Show your students the PowerPoint 2 presentation, including the introduction to CensusAtSchool.
The first three slides set up the purpose for CensusAtSchool and talk about participating in the census. Understanding the purpose of a survey is important for those who choose to participate.
The next three slides discuss the bullying survey questions. The slides allow the teacher to introduce the topic of bullying, definitions of bullying, the idea of getting consistent responses for the survey and where to go for support.
Share the four questions on bullying from the 2015 CensusAtSchool survey (Copymaster 4). Ask the students to think about how they would respond to these survey questions and then to discuss how they would feel about answering these survey questions? How are these survey questions about bullying different to the ones we looked at earlier? How are they similar?
These are all ideas that can inform the students developing their own survey questions about bullying.
Collecting demographic data
In the next lesson students will develop survey questions about bullying. One of the areas to think about is what demographic data should be collected.
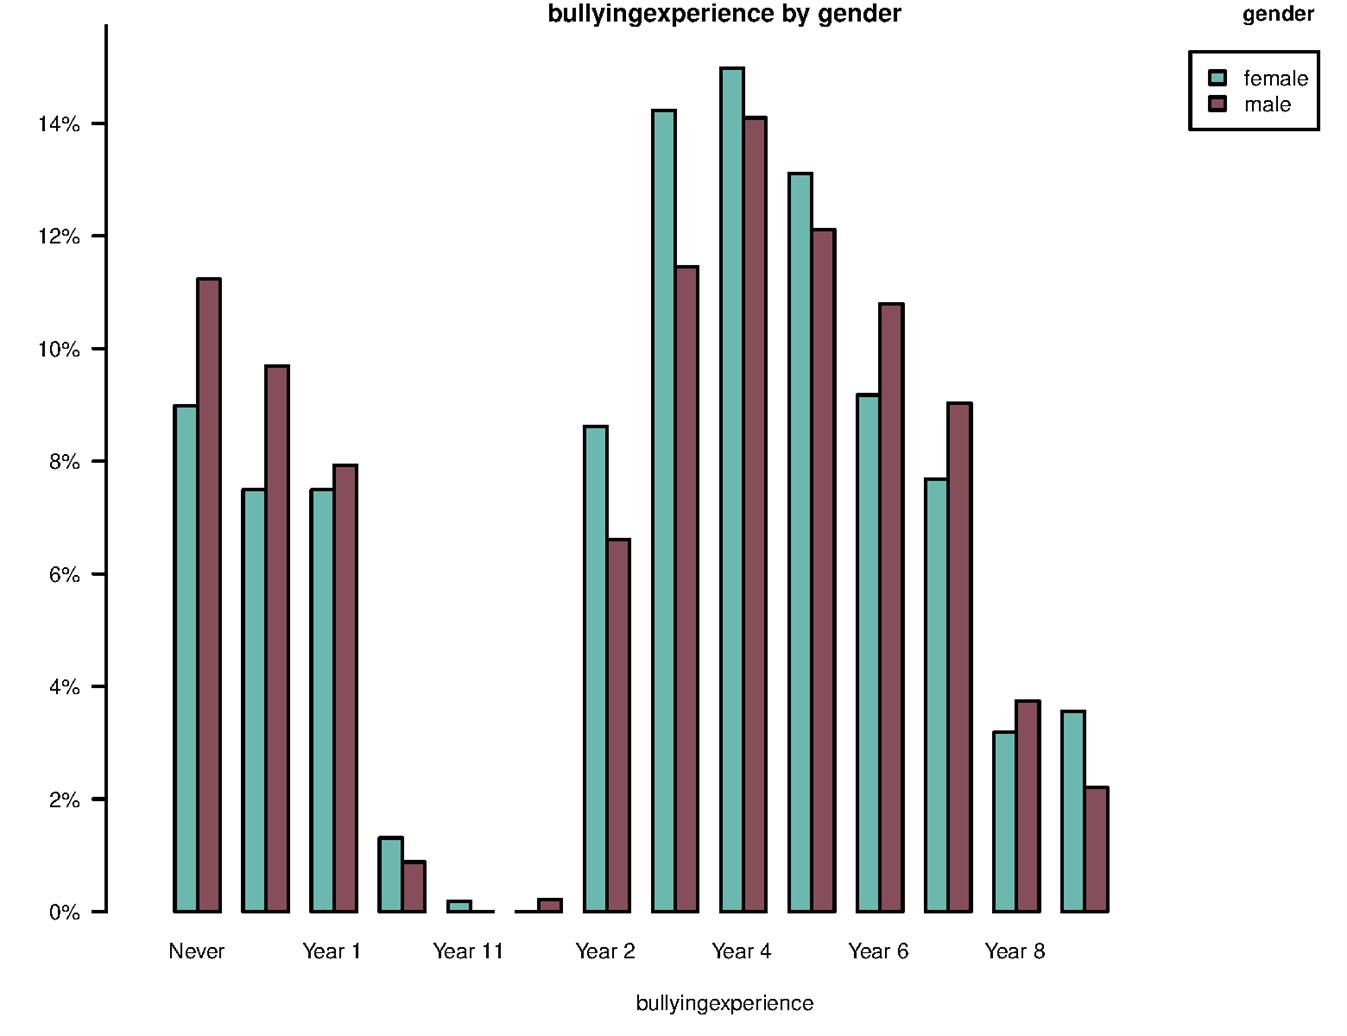
Demographic data includes data about ethnicity, gender, location, education, class level, position in family etc. Demographic data is often used to split the data into groups to compare. For example, two of the graphs (Graphs 6 and 9) from the CensusAtSchool survey (Copymaster 2) on bullying show the data compared by gender. Graph 6 is also shown below.
What personal information should be found out about the students?
Students might suggest the usual demographic variables such as age, class level, gender, and ethnicity. They may suggest other variables of interest, such as position in the family, e.g. first born, middle child, youngest child.
Ask the students if we should ask for people’s names and why or why not? Hopefully, they will say no and make links to confidentiality and validity (i.e. people might not answer honestly if they can be identified).
It is good to also ask about other demographic data that they have suggested.
Which of these might also identify people too easily, even if we do not have people's names?
Suggestions could include ethnicity, especially if there is only one child of a certain ethnic group in a class, and even ethnicity with gender – a single girl or boy of one ethnicity.
Lesson Three: PLANNING to collect data to answer investigative question(s)
Remind students that the topic we are investigating is bullying. We will develop survey questions to explore the topic in this lesson. To investigate the topic we need to think about the areas of bullying that we could target.
Share with the students that bullying surveys usually include sections of survey questions. The sections are based on what the investigators want to find out. Common themes are:
- Types of bullying and frequency (What and how often?)
- Location and timing (Where and when?)
- Responses to bullying by students (How do they react?)
- Knowledge of help to counter bullying (Who/Where to go to? What can you do to help?)
- Effects of bullying on the well-being of victims (What are the effects?)
- Rationale for bullying (Why do students think bullies bully?)
- Improvements (How can the school improve?)
Reflect on previous survey questions from lesson two and identify which of these themes the survey questions are about.
Developing survey questions on bullying
Ask your students to choose four themes and write one or two survey questions for each one. Suggest limited response survey questions rather than open survey questions to keep data handling manageable. Handling of open response data is dealt with later. You may want to discuss PowerPoint 3 which shows the three most common types of closed survey questions. Focus on the advantages and disadvantages of closed survey questions.
- Advantages: Short time for respondents to complete, data is easy to code and interpret, allows use of numbers (quantitative methods).
- Disadvantages: Respondents are forced to select an answer they do not totally agree with, reasons why they answer as they do are not available.
Let your students work in teams of three to develop survey questions. Preferably they should do so digitally so the survey questions can be edited, and combined with others, to form the final survey. Provide feedback as you go around.
Will the survey questions provide important data?
Are the survey questions simply, and briefly written?
Are the words and phrases unambiguous?
Does each survey question include only one idea, not multiple ideas?
Are the survey questions neutral, avoid leading statements, and offer a full range of options for students to choose?
About ethics:
Is the survey question one that students at our school would be happy to answer?
Are the survey questions sensitive to different cultural and religious perspectives?
Before sharing survey questions with the class, ask the students to trial each survey question with at least two other students who are not in their team. The survey questions should be rewritten if needed.
Share a few of the survey questions with the whole class. Focus on the above criteria for good survey questions. Organise the survey questions under the seven themes above.
Defining our investigative questions
Our next task is to develop a questionnaire to answer our investigative questions. First though we need to define our investigative questions we want to answer.
Reflecting on all the exploration and development work we have done to date, pose 2-3 investigative questions that we can answer through collecting data about bullying. The themes we have looked at previously will help you with this. [For more on posing investigative questions see Travel to school]
Creating a questionnaire to answer our investigative questions
Display all the survey questions that were developed under the theme headings. Students develop a bullying questionnaire in teams of three. Set the restriction that the survey must:
- Ask three demographic survey questions (Name is not included – Why?)
- Address four themes
- Ask two or three survey questions per theme
- Include survey questions that will help to answer their investigative questions
Have the class pool of survey questions stored digitally on an accessible drive so that students can cut and paste to form their questionnaires. It is a good idea to introduce checking once the questionnaires are drafted. Each group can check to see that the questionnaire of another group is sound.
Once the questionnaires are checked and completed these should be entered into an online survey tool, such as Google Forms or SurveyMonkey. Be aware that some platforms often incur a charge. Two advantages of digital platforms are that the data is entered by respondents, and the data is downloadable as a spreadsheet.
Prepare for the surveys to be completed by other classes. Think about the ethics of data collection as a class and which of these are important in the invitation we send and the information we give to the classes that will complete our surveys for us. The main ideas to discuss here are:
- obtaining informed and voluntary consent from participants
- respecting participant’s right to withdraw at any time without giving a reason
- respecting and protecting participants’ privacy and confidentiality
- avoiding any unnecessary deception to participants
These ideas can also inform an introduction to the survey which outlines things such as the survey is anonymous, no names are collected, and no identifying information is asked.
Lesson Four: Collecting DATA and ANALYSING data
- Get each group to gather data from another class in the school using their survey. This will probably involve going to the class, a brief introduction to the purpose of the survey and then being available during the survey to answer any questions.
- Students could also survey a class from another location if you have a reciprocal arrangement. The advantage of reciprocal arrangements is that your students will experience first-hand being a respondent to a survey. That will make them sensitive to the importance of clear survey question construction, and the time taken to respond.
- Once the students from other classes have completed the survey, students can process their data. While processing can be done manually there are advantages to using statistical software e.g. CODAP or similar, in terms of display and calculating statistics. For more on using CODAP see Travel to School and Planning for a statistical investigation Level 3.
Lesson Five: CONCLUSION – answering the investigative question and reporting our findings
In the final reflection part of the unit students are required to report their findings about bullying. They are also encouraged to think about their process of investigation and what they have learned from it.
- Provide time for your students to construct a report that shows the results of the investigation. Copymaster 5 could be provided electronically as a .docx or copied into a google doc so that students can write into it, and import data displays they have created.
- Invite different groups to share their findings. Accept the fact that a non-finding, such as little bullying is reported, is a legitimate result. Where bullying is reported, look for students to connect the variables as well as reporting on the results of individual questions. For example, there might be a connection between type of bullying and location or time that the bullying occurs, e.g. social bullying occurs most in the playground at play and lunch times. Also encourage the students to make recommendations about how the school can apply and use anti-bullying strategies, such as educating students about how to respond to bullying, and being aware of the most vulnerable students.
- The class might compile a report for the principal or Board of Trustees detailing the findings and recommendations. Any report should respect the confidentiality of the students who responded so that details about individuals, and classes, remain confidential. Links could also be made to persuasive and informative purposes for writing.
- If time permits you might like to investigate how to deal with data from open response questions. PowerPoint 4 has an example of an open response question, and a fictitious set of examples of students’ answers. Coding of open responses generally proceeds in two ways:
- A set of categories is established beforehand based on expectations, preferably informed from reading.
- Builds categories as they become needed.
- Ask your students to read the comments on Slide Two.
Are there things in common about the comments? How could we group them? - Students might suggest sensible ways to classify the comments. Alternatively, click the mouse so that the comments appear in different colours.
How have the comments been grouped? - Challenge students to describe the categories. They might suggest:
- Yellow: Student’s behaviour encourages bullying
- Green: Racial discrimination
- Blue: Physical disability
- Pink: Family circumstances
- Purple: Learning disability
- If any groups have collected open response data that might be used as an example where students can practise coding data.
Dear family and whānau,
This week we will be exploring how data can be used to inform people about issues. We will look at data about bullying, how that data is obtained, and the implications of it. Using that knowledge, we will create a survey to use with other students, gather some data, analyse the data, and report the findings. Our report will make recommendations.