This is a level (3+ to 4+) mathematics in science contexts activity from the Figure It Out series.
A PDF of the student activity is included.
Click on the image to enlarge it. Click again to close. Download PDF (917 KB)
Students will:
- use data and tables to make predictions in an authentic context.
Students should discover that:
- multiple factors need to be taken into account when estimating or predicting outcomes in the natural world
- an everyday benchmark can help make sense of large quantities (for example, 1 cumec = 5 full bathtubs of water).
FIO, Using Resources, Levels 3+-4+, How High's the Water Now, Mum?, pages 22 - 24
Preparation and points to note
This activity requires students to gather together pieces of information from a single, complex diagram. Closely examine the diagram before introducing it to your students; some students may need careful scaffolding.
As with any activity involving groups, select members of groups so that students of different ability and temperament can take advantage of each other’s strengths.
The language and concepts in this activity will be new to most students: exposure to a rich range of
experiences is one of the aims of the key competency of using languages, symbols, and texts.
Points of entry: Mathematics
This activity is primarily about interpreting statistical data.
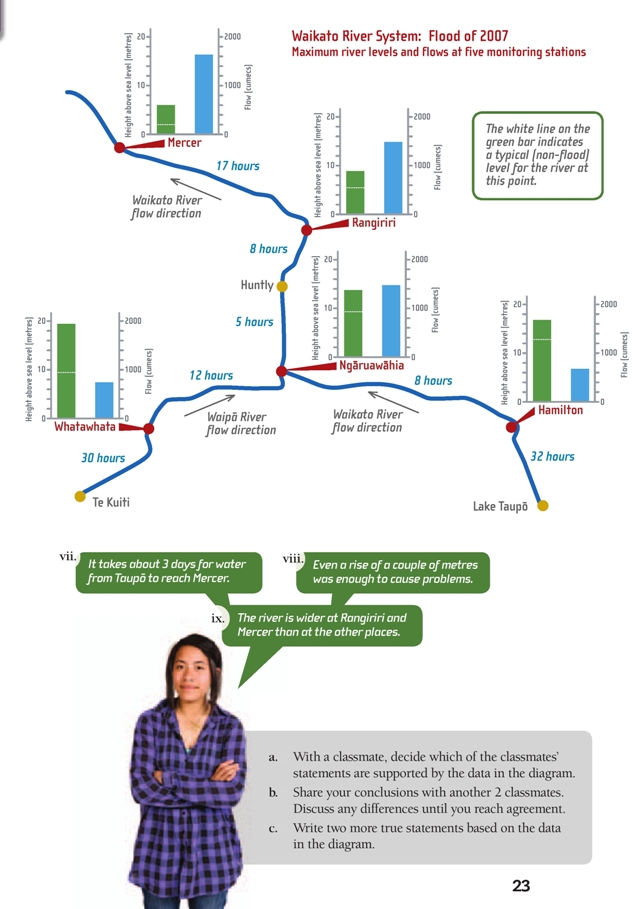
The diagram contains three different sets of data: height (of river above sea level), flow (in cumecs), and time (for water to get from one monitoring station to the next). The diagram also shows the spatial relationship of the 5 stations. The height and flow data relates specifically to the flood of 2007.
Students who are used to dealing with a single data set and 1 graph at a time may be challenged by the apparent complexity of a diagram that brings together several sets of data and multiple graphs. In a situation like this, they should start by focusing on 1 data set and try to fully understand what it can tell them before moving on to another data set and doing the same. In this case, they could begin with the time (hours) data. After focusing on the data sets one at a time, they can begin thinking about the interplay between them.
Students may also have difficulty with the height and flow data because the bars for each are included on the same small graphs but represent totally different measures (this practice is often found in infographic-type diagrams in newspapers and magazines). Because the measures are different (cumecs versus metres), the two bars can’t be directly compared: it makes no sense, for example, to say that flow at Rangiriri is greater than height. You may need to explain this carefully, pointing out that the two bars have their own, entirely different scales. Although both happen to have 10 seemingly identical divisions, this is the result of a design decision, not a mathematical relationship.
It is, however, entirely appropriate to compare either the height or the fl ow of the river at different monitoring stations.
The horizontal white line on the river height bars (the green bars) is an important piece of information that you may need to draw your students’ attention to (see boxed information on page 23 of the students’ book). It represents a “typical” or “normal” height. Without this information, it is impossible to say how much the river has risen in flood because levels at monitoring stations further from the sea are always higher than those closer to the sea (naturally – the water flows down to the sea). In practice, the level of a river typically fluctuates within a range of approximately 1 or 2 m. The white line roughly represents the median.
By adding together the average water travel times between the different monitoring stations, the students can estimate the time the flood peak will take to reach a certain station. Give these times meaning by relating them to the students’ day.
Students may have noticed river height scales by major rivers. These scales suggest a question: Height above what? The simple answer is “sea level”. But this suggests another question: What is sea level given that the level of the sea fluctuates by time of day, phase of moon, atmospheric conditions, and every wave? So that genuine comparisons can be made, all measurements made in the Waikato river system use a common reference point known as the Moturiki Datum.
The following table contains height and flow data for the 2007 flood (on which the diagram was based) as well as height and flow data for other major floods. As an extension activity, the students could create graphs for another flood or bar charts for height and fl ow across the 5 floods.

Points of entry: Science
This activity focuses on aspects of the water cycle and on human attempts to explain and control it.
Some students may have prior knowledge of floods; discuss events that they may have witnessed or read about and collect media coverage if possible.
Encourage the students to think about the impact of fast-fl owing water on the landscape and riverbanks. Discuss the different ways in which humans try to reduce the destructive impact of major floods, particularly through the use of storage lakes, dams, stopbanks, and early-warning systems. If your school is in the vicinity of a major hydroelectric scheme, ask the students to investigate how the dams that supply electricity are managed to also minimise flooding. They could also investigate the negative impacts of very large-scale river control schemes. Some of the most dramatic examples are to be found overseas.
It is important that students understand that while previous data can be used to predict what is likely to happen in the future and as a basis for schemes to reduce harmful impact, such predictions are only best guesses. As in any naturally occurring event, there are always unknowns. For example, severe rainfall events are often surprisingly localised, so even when level and flow at one point suggest what will happen downstream, other water may flow into the river from streams between the two points and complicate the predictions. Also, heavy rain falling on ground that is already saturated will have a very different impact from the same rain falling on dry ground (see the previous activity, Too Much Water).
As an extension, the students could do their own research into the causes of floods and how scientists predict them.
Answers
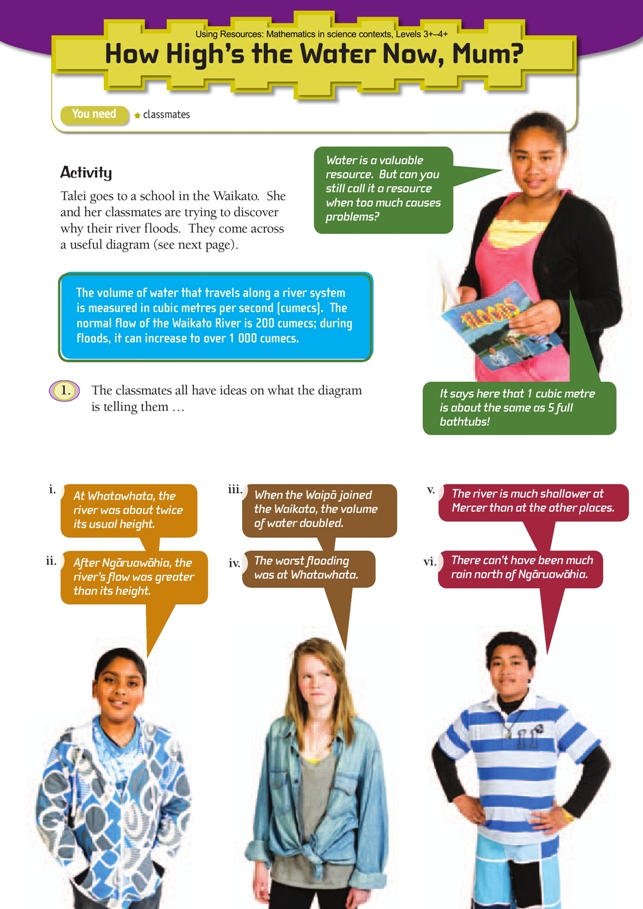
1. a.–b. Decisions may vary. Information that can be read from the data in relation to each statement is:
i. True. The river was running at a height of about 19 m instead of a typical 9 m (see white line on green bar).
ii. False. Flow (cumecs) and height (metres) are two completely different variables (that’s why the bars have different scales) so they cannot be compared in this way. (Likewise, it makes no sense to say that a person’s weight is more than their height.)
iii. True. The individual flows of the rivers (both about 700 cumecs) combine at Ngāruawāhia to give a flow of about 1 400 cumecs.
iv. Not enough evidence. Although the increase in height was greatest here, the water may have been effectively contained by a deep valley.
v. Not enough evidence (though probably true). Mercer is the last monitoring station before the river reaches the sea, so the height must be lowest here. Rivers usually become shallower as they get
near the sea, but the height of a river tells us nothing about its depth.
vi. True. Once the Waipā and the Waikato merge, the flow does not increase by much (from about 1 500 to 1 600 cumecs) as the river completes its journey to the sea.
vii. True. According to the data in the diagram, the water takes approximately 70 hrs to cover this distance. This is just marginally less than the 3 x 24 = 72 hrs in 3 days.
viii. Not enough evidence. The diagram gives no information on damage.
ix. True. The flow at these last two monitoring stations (and at Ngāruawāhia, for that matter) is much greater than at the first two, yet the increase in height (above the “typical” or normal level) is no greater. This can only be because the river is wider (and its capacity is therefore greater).
c. Statements will vary. For example: “The flow at Ngāruawāhia looks like the sum of the flows at Whatawhata and Hamilton”; “It takes almost 2 days for water from Lake Taupō; to reach Huntly”; “The river at Whatawhata must be in a narrow channel because a relatively small flow caused an almost 10 metre increase in the height of the river”; “Normal river levels are deepest at Hamilton”.
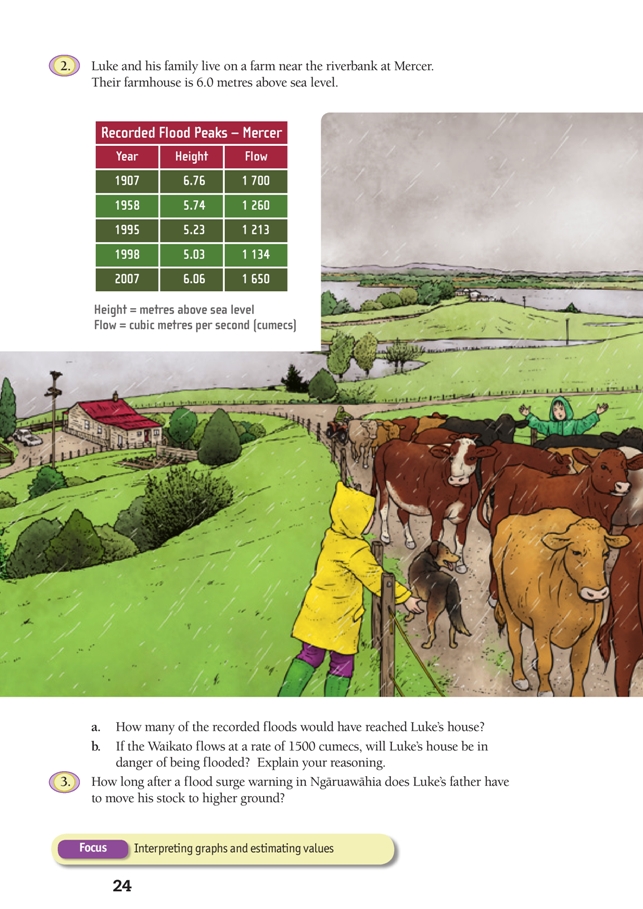
2. a. Two: 1907 and 2007
b. Yes, the house will definitely be in danger of flooding. But it is impossible to say for certain if the water will reach the house. What we can say is that a fairly small increase in fl ow can cause a big increase in height (for example, by comparing the data for 1907 and 2007, we can see that an increase of just 50 cumecs meant an increase in height of 0.7 m).
3. 30 hrs. (5 hrs from Ngāruawāhia to Huntly, 8 hrs to Rangiriri, and 17 hrs to Mercer. 5 + 8 + 17 = 30)