This is a level 4 measurement strand activity from the Figure It Out series.
A PDF of the student activity is included.
Click on the image to enlarge it. Click again to close. Download PDF (260 KB)
measure temperature changes
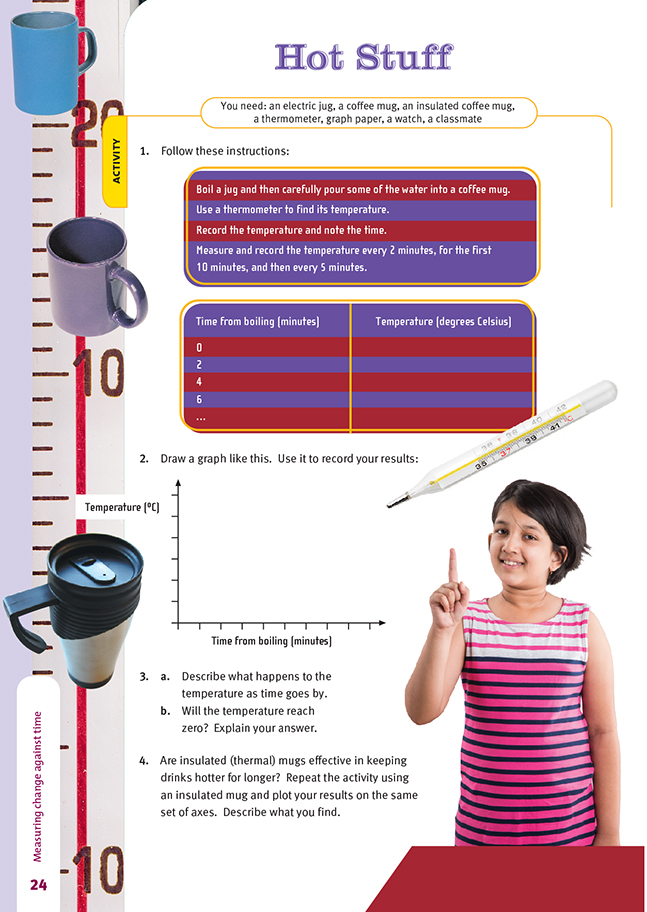
coffee mug, insulated coffee mug
an electric jug
FIO, Level 4, Measurement, Book One, Hot Stuff, page 24
thermometer, graph paper, watch
classmate
This maths task is also a science experiment, and students need to treat it as they would an experiment.
They should be allowed to work out the details themselves, following a clear and serious warning that their method must not put them at risk of scalding.
These headings will provide a structure for the task, from beginning to end:
- focusing
- planning
- information gathering
- processing
- interpreting
- reporting.
This experiment is simple to set up, with the only specialist item required being a thermometer capable of being immersed in liquids at boiling point (a glass spirit thermometer or a digital probe thermometer are both suitable and fairly inexpensive).
The students should take the temperature of the water immediately it is put into the mug, then every 2 minutes for the first 10 minutes because this is when it is falling most rapidly. After this, they can extend the interval between observations. If possible, measurements should continue to be taken for at least 2 hours, by which
time the liquid should be down to within 4 degrees of room temperature.
When comparing the thermal qualities of different mugs in question 4, the students need to realise that they must use the same amount of water in each case. This is because large volumes of liquid lose temperature more slowly than small volumes. Using just one thermometer, it should be possible to monitor the temperature
of liquids in several different mugs.
When temperatures are plotted, a time-series graph results, with a curve that slopes away to the right. It is unlikely that the first reading will record a result of 100° because the temperature drops extremely quickly as the water comes in contact with the air and the cold cup. The graph will fall away very steeply at first and then gradually become closer to the horizontal as a stable temperature is reached.
The students could experiment with pre-heating a coffee mug and seeing what difference this makes to the initial drop-off in temperature. They would do this by first filling the mug with boiling water, letting it stand for a minute or two, then emptying it and refilling it with boiling water. They would then start recording the temperature.
Cross-curricular links
Science
This particular type of time-series graph is similar to a decay graph. Such graphs model the decay of radioactive isotopes and demonstrate how it is that they can remain dangerous for exceedingly long periods of time (zero danger being represented by the horizontal axis). The decay of carbon isotopes is similarly modelled, and it is this process that lies behind the carbon dating of prehistoric objects. Students who are scientifically curious could investigate these processes and the related concept of “half-life”, reporting their findings back to the class.
Achievement Objectives
- investigate and describe their ideas about some commonly experienced physical phenomena to develop their understanding of those phenomena (Making Sense of the Physical World, level 3)
- process and interpret information to describe or confirm trends and relationships in observable physical phenomena (Making Sense of the Physical World, level 4)
Answers to Activities
1. Practical activity
2. Graphs will vary but should show a tailing off as the liquid approaches room temperature.
3. a. The rate at which the water cools decreases as time goes by.
b. No, unless the room temperature is less than 0˚C. It is the surrounding air that does the cooling, so the water can’t get colder than the air.
4. Practical activity. Results will vary, but the results and graph should show that the temperature of the liquid goes down rather more slowly. (If not, either the experiment has not been conducted appropriately or the insulation on the mug is ineffective.)